
Figures & data
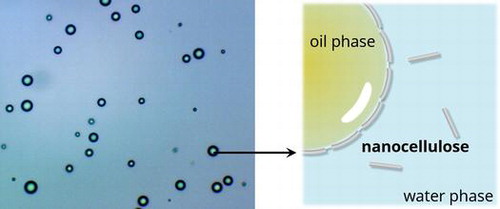
Figure 1. Solid particle at a planar oil/water interface.
Table 1. Summary of cellulose-stabilized Pickering emulsions.
Figure 2. Snapshots of the behavior of separated cellulose chains in the oil-in-water medium during molecular dynamics simulation. The molecules are drawn using the stick representation for cellulose (white), and the line representation for water (blue) and octane (yellow). (Color figure online). Modified from Ref. [Citation83], with permission from Springer (© Springer 2017).
![Figure 2. Snapshots of the behavior of separated cellulose chains in the oil-in-water medium during molecular dynamics simulation. The molecules are drawn using the stick representation for cellulose (white), and the line representation for water (blue) and octane (yellow). (Color figure online). Modified from Ref. [Citation83], with permission from Springer (© Springer 2017).](/cms/asset/403985b7-296e-4003-bde4-f6e713fe45e4/tsta_a_1401423_f0002_oc.gif)
Figure 3. Droplet size dependence on bacterial cellulose nanofibril (BCN) content (upper figure) for droplet diameters D(3,2) versus BCN concentration in the water phase in an emulsion containing hexadecane with a 30/70 oil/water ratio. (lower images) Transmission optical micrographs of the same emulsions; the corresponding concentrations are given in the images. Modified from Ref. [Citation79], with permission from American Chemical Society (© ACS 2011).
![Figure 3. Droplet size dependence on bacterial cellulose nanofibril (BCN) content (upper figure) for droplet diameters D(3,2) versus BCN concentration in the water phase in an emulsion containing hexadecane with a 30/70 oil/water ratio. (lower images) Transmission optical micrographs of the same emulsions; the corresponding concentrations are given in the images. Modified from Ref. [Citation79], with permission from American Chemical Society (© ACS 2011).](/cms/asset/30b495cd-be91-448f-b780-598de6e8dd6b/tsta_a_1401423_f0003_oc.gif)
Figure 4. Phase behavior of nanocellulose-stabilized emulsions as a function of time. The samples in the images contain 1% nanocellulosic material and 20% oil, and the creaming layer is indicated with orange arrows. Samples for micrographs of the different phases were transferred to separate vials at 24 h after preparation, and images were taken at 72 h after preparation. The scale bar is 200 μm. Modified from Ref. [Citation70], with permission from Elsevier (© Elsevier 2017).
![Figure 4. Phase behavior of nanocellulose-stabilized emulsions as a function of time. The samples in the images contain 1% nanocellulosic material and 20% oil, and the creaming layer is indicated with orange arrows. Samples for micrographs of the different phases were transferred to separate vials at 24 h after preparation, and images were taken at 72 h after preparation. The scale bar is 200 μm. Modified from Ref. [Citation70], with permission from Elsevier (© Elsevier 2017).](/cms/asset/e842a4c5-2657-4d14-81f1-237ae6959efb/tsta_a_1401423_f0004_oc.gif)
Figure 5. Dispersions of untreated MFC (top image) and MFC-ODA (bottom image) in water, toluene, EU-diesel, dodecane, and FT-diesel (from left to right). Modified from Ref. [Citation89], with permission from Elsevier (© Elsevier 2010).
![Figure 5. Dispersions of untreated MFC (top image) and MFC-ODA (bottom image) in water, toluene, EU-diesel, dodecane, and FT-diesel (from left to right). Modified from Ref. [Citation89], with permission from Elsevier (© Elsevier 2010).](/cms/asset/af6fbec8-505d-43b8-8a1e-dcfffba13773/tsta_a_1401423_f0005_oc.gif)
Figure 6. Dark-field microscopy images of o/w emulsions stabilized by (a) NFC and (b) CNC; w/o emulsions stabilized by (c) NFC and (d) CNC modified with lauroyl chloride (C12) (NFCC12 and CNCC12, respectively); and o/w/o double emulsions stabilized by (e) NFC/NFCC12, (f) CNC/NFCC12, (g) NFC/CNCC12, and (h) CNC/CNCC12. Water was stained with fluorescein. Scale bar is 50 μm. Modified from Ref. [Citation78], with permission from American Chemical Society (© ACS 2014).
![Figure 6. Dark-field microscopy images of o/w emulsions stabilized by (a) NFC and (b) CNC; w/o emulsions stabilized by (c) NFC and (d) CNC modified with lauroyl chloride (C12) (NFCC12 and CNCC12, respectively); and o/w/o double emulsions stabilized by (e) NFC/NFCC12, (f) CNC/NFCC12, (g) NFC/CNCC12, and (h) CNC/CNCC12. Water was stained with fluorescein. Scale bar is 50 μm. Modified from Ref. [Citation78], with permission from American Chemical Society (© ACS 2014).](/cms/asset/d7294350-4a1f-4675-a010-7aec7de0ce73/tsta_a_1401423_f0006_oc.gif)
Figure 7. (a) Photograph of polystyrene/nanocellulose composite film with 12% w/w nanocellulose after melt pressing, (b) UV–vis transmittance spectra, (c) stress–strain curves, and (d) thermal expansion behavior of the composite and polystyrene films. Modified from Ref. [Citation74], with permission from American Chemical Society (© ACS 2017).
![Figure 7. (a) Photograph of polystyrene/nanocellulose composite film with 12% w/w nanocellulose after melt pressing, (b) UV–vis transmittance spectra, (c) stress–strain curves, and (d) thermal expansion behavior of the composite and polystyrene films. Modified from Ref. [Citation74], with permission from American Chemical Society (© ACS 2017).](/cms/asset/fa66ca85-85a1-47c4-b4a3-80277b10e2df/tsta_a_1401423_f0007_oc.gif)
Figure 8. Confocal laser scanning microscopy images of emulsions stabilized by cotton CNCs containing increasing amounts of hexadecane stained with 4,4-difluoro-4-bora-3a,4a-diaza-s-indacene from (a) the original 10/90 oil/water Pickering emulsion; (b) 65% of internal phase; (c) 85.6% of internal phase; (d) the same as panel c using a stacking of 2D 1 μm-thick optical cross-section images to form a 3D reconstruction. Modified from Ref. [Citation76], with permission from American Chemical Society (© ACS 2013).
![Figure 8. Confocal laser scanning microscopy images of emulsions stabilized by cotton CNCs containing increasing amounts of hexadecane stained with 4,4-difluoro-4-bora-3a,4a-diaza-s-indacene from (a) the original 10/90 oil/water Pickering emulsion; (b) 65% of internal phase; (c) 85.6% of internal phase; (d) the same as panel c using a stacking of 2D 1 μm-thick optical cross-section images to form a 3D reconstruction. Modified from Ref. [Citation76], with permission from American Chemical Society (© ACS 2013).](/cms/asset/3c27269b-3ec6-4075-a3cd-e795ce72cc06/tsta_a_1401423_f0008_oc.gif)
Figure 9. (a) Esterified bacterial cellulose/photopolymerized acrylated epoxidized soybean oil nanocomposite foam (23 mm in diameter). (b) Esterified cellulose nanofibrils are shown to line a pore. Modified from Ref. [Citation105], with permission from Royal Society of Chemistry (© RSC 2009).
![Figure 9. (a) Esterified bacterial cellulose/photopolymerized acrylated epoxidized soybean oil nanocomposite foam (23 mm in diameter). (b) Esterified cellulose nanofibrils are shown to line a pore. Modified from Ref. [Citation105], with permission from Royal Society of Chemistry (© RSC 2009).](/cms/asset/2f70ba4b-d3e0-4359-926d-7998872d0388/tsta_a_1401423_f0009_b.gif)
Figure 10. (a) Thermogravimetric analysis and (b) differential scanning calorimetry curves of nanocellulose paper, phase change material (PCM) paper, and pure PCM. c) Optical image of PCM paper during the heat/cool cycles between 20 °C (left) and 50 °C (right) after 10 cycles. d) Stress–strain curve of the PCM paper. Modified from Ref. [Citation83], with permission from Elsevier (© Elsevier 2017).
![Figure 10. (a) Thermogravimetric analysis and (b) differential scanning calorimetry curves of nanocellulose paper, phase change material (PCM) paper, and pure PCM. c) Optical image of PCM paper during the heat/cool cycles between 20 °C (left) and 50 °C (right) after 10 cycles. d) Stress–strain curve of the PCM paper. Modified from Ref. [Citation83], with permission from Elsevier (© Elsevier 2017).](/cms/asset/f2325d56-fdb7-4210-bb2e-a554c697751a/tsta_a_1401423_f0010_oc.gif)
Figure 11. Schematic of emulsion preparation and electrospinning of CNC−poly(lactic acid) (PLA) emulsions. Modified from Ref. [Citation107], with permission from American Chemical Society (© ACS 2013).
![Figure 11. Schematic of emulsion preparation and electrospinning of CNC−poly(lactic acid) (PLA) emulsions. Modified from Ref. [Citation107], with permission from American Chemical Society (© ACS 2013).](/cms/asset/3b135252-2e19-4568-bc18-7b2d5e217ef0/tsta_a_1401423_f0011_oc.gif)