Figures & data
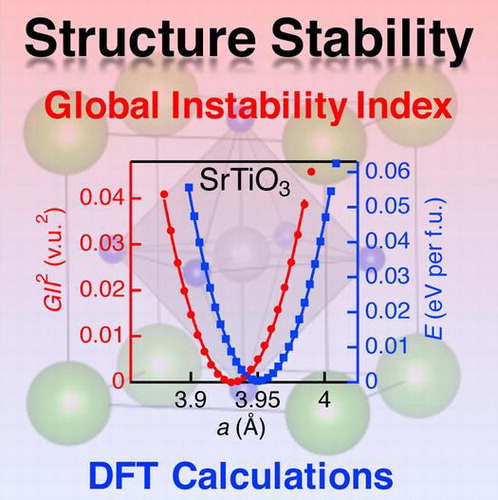
Figure 1. Global instability index for typical ABO3-type metal oxides in cubic perovskite structure.
Figure 2. Global instability index and discrepancy factors for selected ABO3-type metal oxides in cubic perovskite structure; (a) SrTiO3, (b) BaZrO3, (c) CaTiO3, and (d) BaTiO3.
Table 1. Tolerance factor (t), ionic radius of A- and B-ions, GII for cubic (GII cubic) and distorted perovskite structures (GII exp), a 0, and crystal structure at room temperature determined by experiment for selected ABO3-type oxides.
Figure 3. Square of global instability index (red circles) and relative total energy (blue squares) as a function of a for (a) SrTiO3 and (b) BaZrO3 in cubic perovskite structure. The curves represent the fitting results using quadratic function.
Table 2. Fitting results of GII 2 and relative total energy using quadratic function for SrTiO3 and BaZrO3.
Figure 4. Comparison of structure instability between total energy and GII. The line represents the linear fitting result.