Figures & data
Figure 1. Normalised (a) PCE, (b) V OC , (c) J SC and (d) FF (to the initial maximum values) of BTR:PC71BM devices, with active layers which have undergone increasing SVA time, as a function of photo-ageing time under one-sun equivalent illumination at room temperature in dry nitrogen.
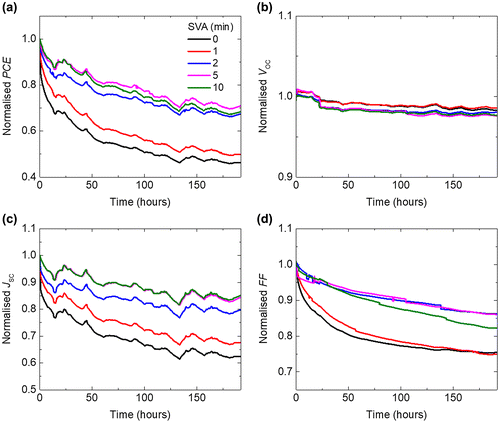
Table 1. Performance of BTR:PC71BM devices with the active layers treated for increasing SVA time.
Figure 2. (a) GI-XRD spectra and (b) normalised GI-XRD spectra, of BTR:PC71BM films with increasing SVA time, before and after photo-ageing.
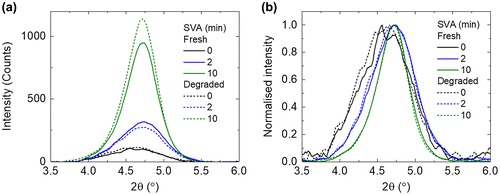
Figure 3. UV–vis absorbance spectra of the fresh and photo-aged BTR:PC71BM films: 0 min SVA, 2 min SVA and 10 min SVA films (a) without normalisation and (b) with normalisation to the PC71BM peak at 378 nm.
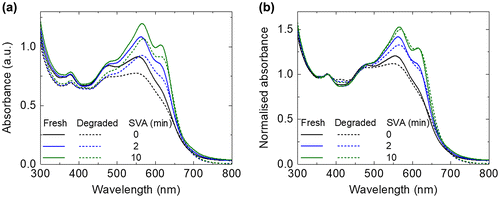
Figure 4. (a) Raman spectra of BTR:PC71BM films with increasing SVA time, before and after photo-ageing, (b) calculated Raman spectrum of BTR using B3LYP 6311G(d,p) with all alkyl side chains simplified to methyl groups, (c) normalised Raman spectra of BTR:PC71BM films with increasing SVA time, before and after photo-ageing (inset shows zoomed-in of peak C), (d) normalised calculated Raman spectrum of BTR with different dihedral angle between the BDT and thiophene 4 unit using the same simulation method and (e) the chemical structure of BTR with numbered thiophenes for Raman peak assignment. The main backbone has dihedral angles ranging from ~15° to 25°. The thiophenes numbered as 4 are ~61° out of the plane of the BDT core.
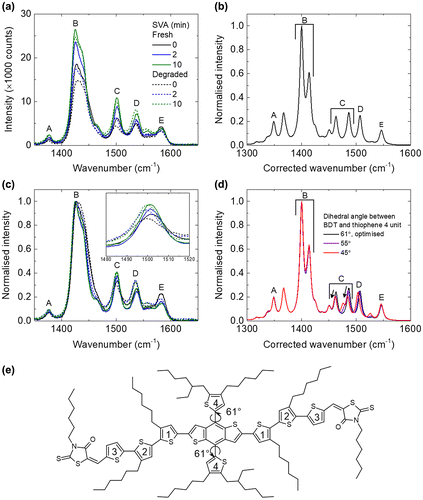
Table 2. Assignments of the Raman peaks shown in Figure .
Figure 5. (a) PL spectra corrected by its absorbance at 532 nm (corresponding to the excitation wavelength) and (b) normalised PL spectra of BTR:PC71BM films with increasing SVA time before and after photo-ageing.
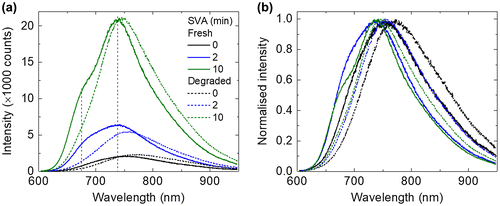
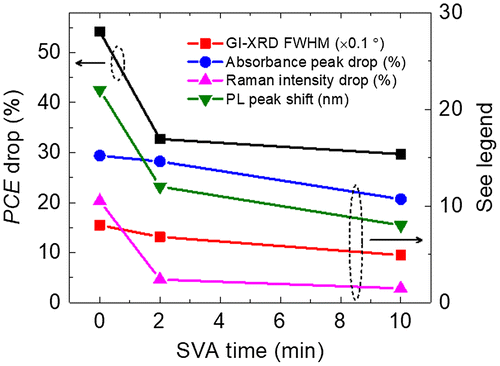
Figure 6. PCE drop, absorbance peak drop, relative Raman intensity drop and PL peak shift after the photo-ageing as a function of SVA time. For the GI-XRD FWHM, it is measured for fresh films (no obvious change after the photo-ageing).