Figures & data
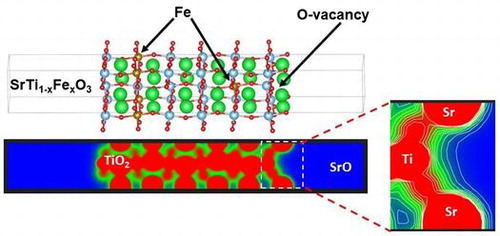
Figure 1. Investigated models of bulk SrTiO3, bulk iron-doped SrTiO3 without oxygen vacancies, bulk iron-doped SrTiO3 with one oxygen vacancy per two iron atoms, SrO terminated surface of SrTiO3, SrO terminated surface of iron-doped SrTiO3 without oxygen vacancies, SrO terminated surface of iron-doped SrTiO3 with oxygen vacancy in the surface layer, and SrO terminated surface of iron doped SrTiO3 with oxygen vacancy in the subsurface layer.

Figure 2. DOS and PDOS of (A) bulk SrTiO3; (B) bulk iron-doped SrTiO3 without oxygen vacancies; (C) bulk iron-doped SrTiO3 with one oxygen vacancy per two iron atoms.
Figure 3. DOS and PDOS of (A) SrO surface of SrTiO3; (B) SrO surface of surface iron-doped SrTiO3 without oxygen vacancies; (C) SrO surface of iron-doped SrTiO3 with oxygen vacancy in the surface layer; (D) SrO surface of iron-doped SrTiO3 with oxygen vacancy in the subsurface layer.
Figure 4. Projected average electron density along the c axis of the slabs for (A) SrTiO3 slab; (B) iron-doped SrTiO3 slab without oxygen vacancies; (C) iron-doped SrTiO3 slab with oxygen vacancy in the surface layer; (D) iron-doped SrTiO3 slab with oxygen vacancy in the subsurface layer. Electron density is given in e−/Å3.
Figure 5. Slice-planes through the electron density along the c axis of the slabs for (A) SrTiO3 slab; (B) iron-doped SrTiO3 slab without oxygen vacancies; (C) iron-doped SrTiO3 slab with oxygen vacancy in the surface layer; (D) iron-doped SrTiO3 slab with oxygen vacancy in the subsurface layer. Electron density is given in e−/Å3. Electron density between 0 and 1 e−/Å3 is plotted in the blue–green–red color scheme. Contour lines slow the electron density surfaces at each 0.1 e−/Å3.
Figure 6. Starting and end geometries for first-principle molecular dynamics simulation at 1000 °C for (A) iron-doped SrTiO3 slab without oxygen vacancies and (B) iron-doped SrTiO3 slab with oxygen vacancy in the surface layer. Sr is denoted with green color, Ti is denoted with blue color, Fe is denoted with brown color, and O is denoted with red color.