Figures & data
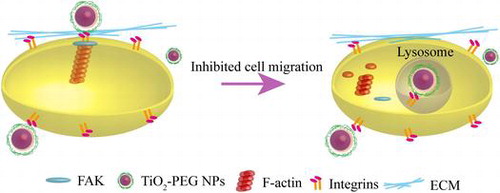
Figure 1. TiO2-PEG NPs inhibit cell migration in a size-dependent manner. NCI-H292 cells were seeded overnight prior to the creation of scratches with p200 pipet tips. The cells were then exposed to TiO2-PEG NPs (100, 200, and 300 nm) at a concentration of 100 μg/mL for 3 h. (A) Scratch width changes with or without NP exposure, scale bar: 100 μm; (B) Quantification of cell migration with or without NP exposure. Crt stands for control samples. All data are displayed as mean ± SD with at least three parallel groups and were analyzed using one-way ANOVA. *p ≤ 0.05, **p ≤ 0.01.
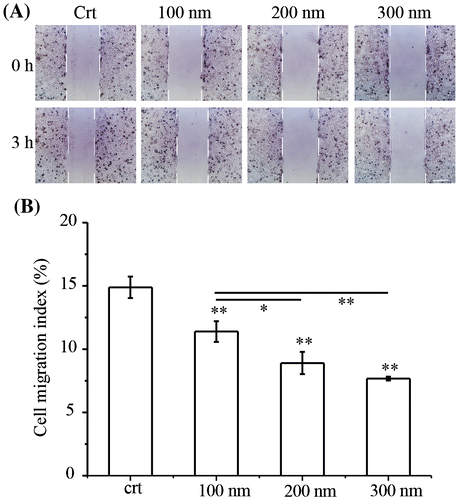
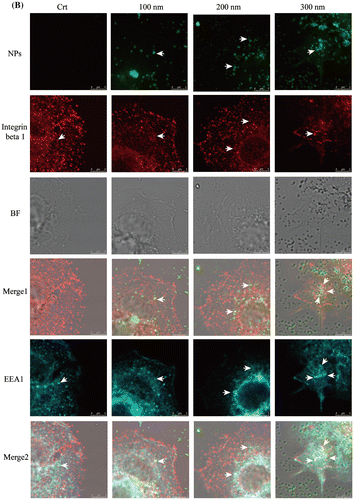
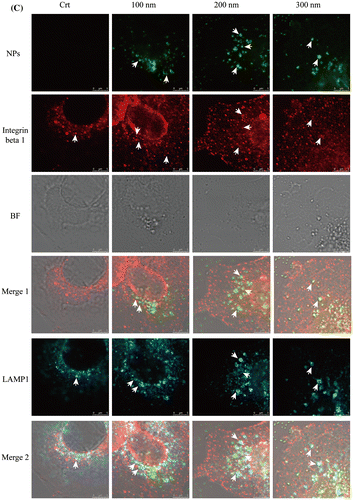
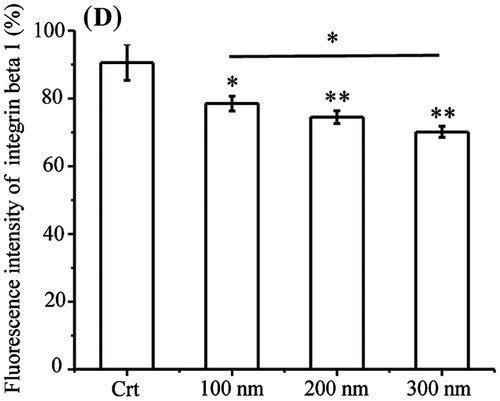
Figure 3. Ratios of lysosomal integrin beta 1 with or without NPs exposure. Cells were seeded and exposed to the TiO2-PEG NPs (100, 200, and 300 nm) at a concentration of 100 μg/mL for 3 h. After observation by confocal microscope, the numbers of lysosomes, lysosomal integrin beta 1, and lysosomal integrin beta 1 with NPs were counted and calculated as shown above. For each group, five cells were selected for counting and calculation. Crt stands for control samples. All data are displayed as mean ± SD with at least three parallel groups and were analyzed using one-way ANOVA. *p ≤ 0.05, **p ≤ 0.01.
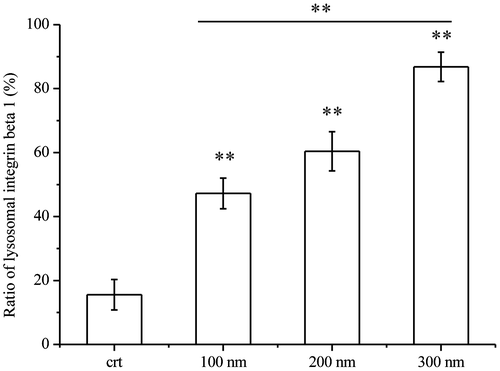
Figure 4. Quantification of pFAK. Cells were seeded and exposed to the TiO2-PEG or FITC-TiO2-PEG NPs (100, 200, and 300 nm) at a concentration of 100 μg/mL for 3 h. Crt stands for control samples. All data are displayed as mean ± SD with at least three parallel groups and were analyzed using one-way ANOVA. *p ≤ 0.05, **p ≤ 0.01.
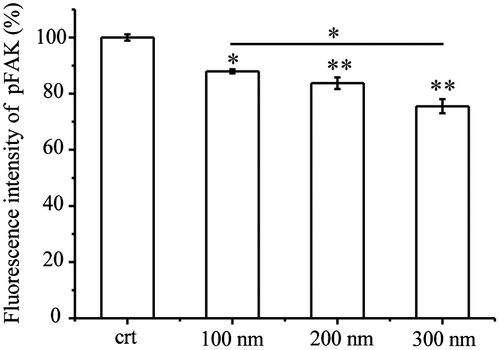
Figure 5. Expression and localization of F-actin. Cells were seeded and exposed to the TiO2-PEG NPs (100, 200, and 300 nm) at a concentration of 100 μg/mL for 3 h. (A) Quantification of f-actin expression; (B) Localization and structural assessment of f-actin and pFAK. Crt stands for control samples. All data are displayed as mean ± SD with at least three parallel groups and were analyzed using one-way ANOVA. *p ≤ 0.05, **p ≤ 0.01.
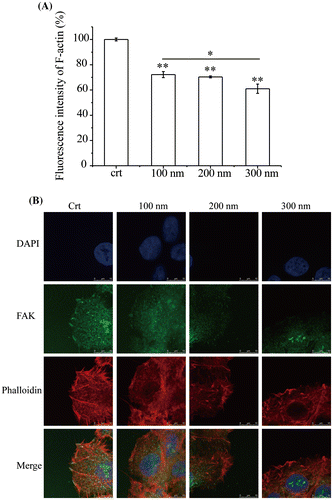
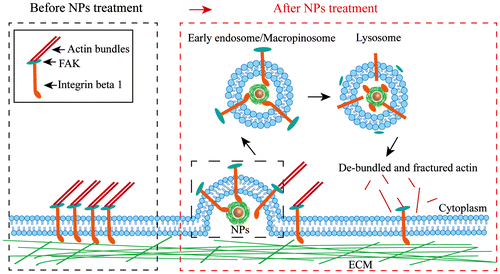
Figure 6. Schematic of the possible mechanisms of the inhibition of cell migration caused by NPs via integrin beta 1.