Figures & data
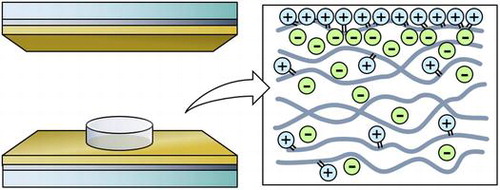
Figure 1. (a) Schematic of fabrication process of surface-charge-fixed polymer. (b) Schematic of internal structure of fabricated polymer.
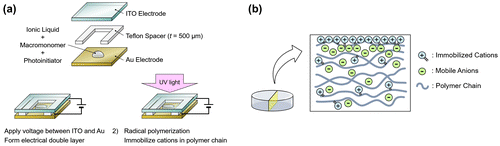
Figure 2. (a) Schematic of device structure and current measurement setup using a current input preamplifier. (b) Schematic of device structure and voltage measurement setup using an instrumentation amplifier.
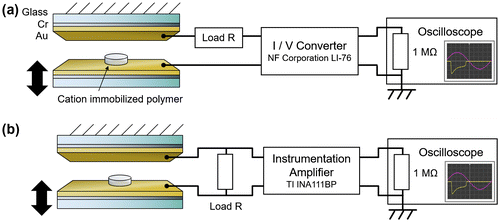
Figure 3. (a) Typical short circuit (SC) current wave profile. The sinusoidal shaker displacement is also included in the left panel to show the phase relationship between the current and the mechanical excitation. (b) Typical open circuit (OC) voltage wave profile.
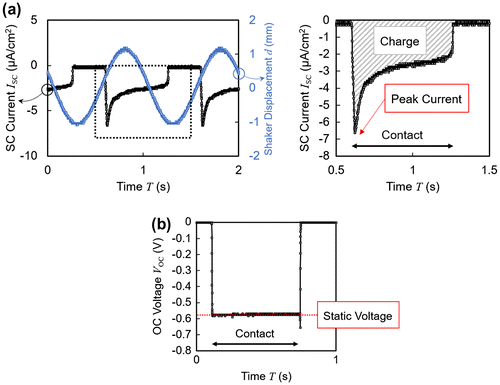
Figure 4. (a) Output current wave profiles with varying load resistance. (b) Average power plotted with respect to load resistance.
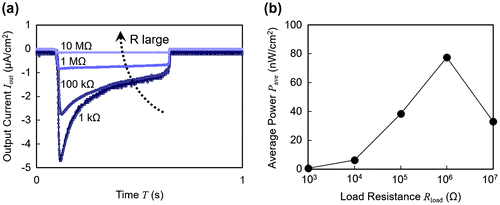
Figure 5. Electrical profiles plotted against varying concentrations of ionic liquid (IL) within the polymer matrix. (a) Peak current. (b) Transferred charge. (c) Static voltage.
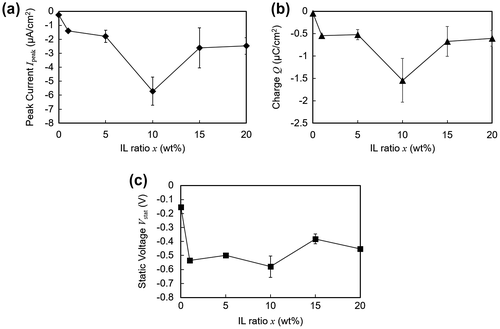
Table 1. Sample conditions for control experiments.
Figure 6. Short circuit current wave profiles of samples shown in Table . The red arrow indicates the contact point and the blue arrow indicates the releasing point. (a) Ionic liquid free polymer. (b) Charge-fixed polymer without polarization. (c) Surface-charge-fixed polymer with polarization.
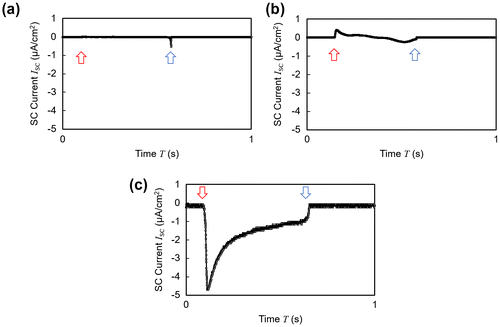
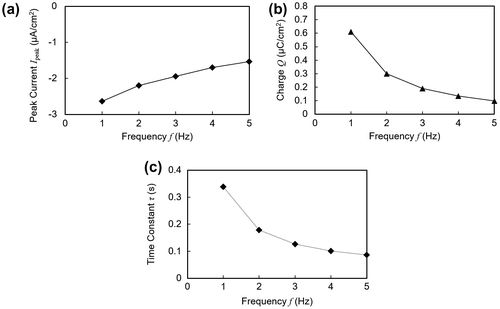
Figure 7. Electrical profiles plotted against varying frequencies of applied vibration. (a) Peak current. (b) Transferred charge. Charge amount is for one contact duration as shown in Figure (a). (c) Time constant.