Figures & data
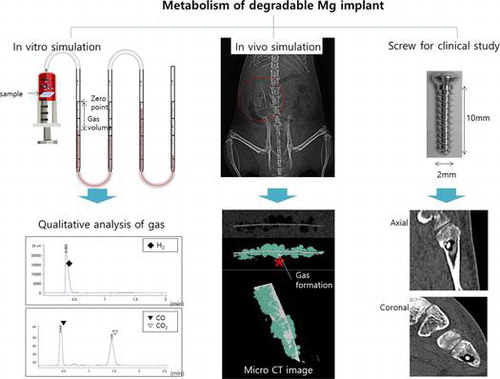
Figure 1. (A) SEM images of the Mg surface after immersion in EBSS for (a) 5, (b) 15, and (c) 30 days, EDX spectra after (d) 5, (e) 15, (f) 30 days, and EDX spectra of points (c-1) and (c-2) from image (c); (B) SEM images of the Mg surface after implantation to rat for (a) 5, (b) 15 and (c) 30 days, EDX spectra after (d) 5, (e) 15, (f) 30 days and EDX spectra of points (b-1) and (b-2) from image (b).
Figure 2. (A) Potentiodynamic polarization curves and (B) Nyquist plots of electrochemical impedance spectroscopy data after immersion for 5, 15 and 30 days in EBSS.
Table 1. Summary of results fitted from potentiodynamic polarization curves and Nyquist plots after immersion periods for 30 days.
Figure 3. (A) The amount of formed gas measured daily for 30 days and Mg ion concentration measured every 5 days during immersion in EBSS for 30 days, and (B) Gas component analysis measured by (a) FID and (b) TCD during immersion in EBSS for 30 days.
Figure 4. (A) Micro CT images of Mg plate (white color) and gas pocket (light blue) after implantation in rats for 5, 15 and 30 days, (B) Volume of the Mg plate and gas pocket after implantation in rats for 30 days, and (C) Mg ion concentration in muscle tissue attached to the specimen, kidney and liver measured by ICP-MS.
Figure 5. HE stained histological images of (A) the tissue attached to the specimen (The direction of the arrows is the implantation site, and gas pockets mark as asterisk, *), and (B) the kidney and liver tissues after implantation.
Figure 6. Foot AP and oblique X-ray images of gas formation by magnesium screw (red arrows), and axial, coronal, and sagittal CT scan images of air bubbles surrounding magnesium screw inserted into metatarsal fracture for 12 months.