
Figures & data
Table 1. GOMs prepared at different weight ratios of GO/TETA/HEC.
Figure 2. (a) XRD patterns and (b) FTIR spectra of pristine GO, HEC, TETA, and GOMs, respectively.
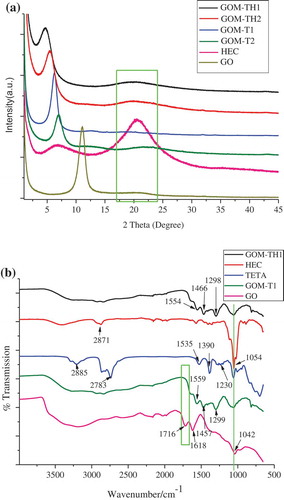
Figure 3. O1s spectra of (a) HEC, (b) GOM-T1, (c) GOM-TH1, and (d) pristine GO.
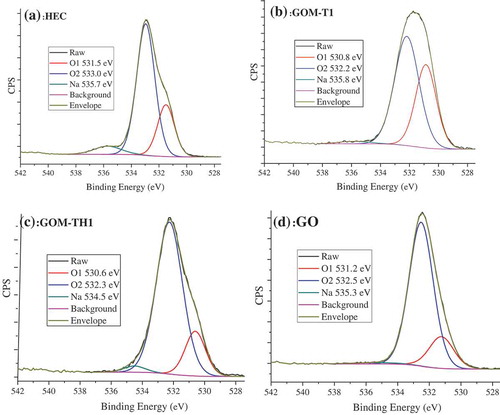
Table 2. Elemental composition in atomic percentage (%) derived from XPS survey spectra.
Table 3. The relative fraction of the O, C, and N contributions derived from peak fitting of high resolution O1s, C1s, and N1s XPS spectra.
Figure 4. (a) TGA and (b) DTG curves of pristine GO, HEC, GOM-T1, and GOM-TH1.
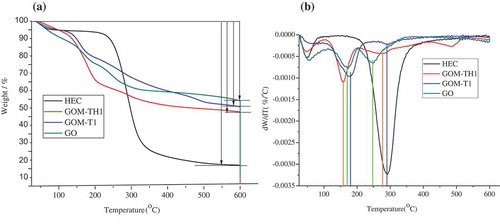
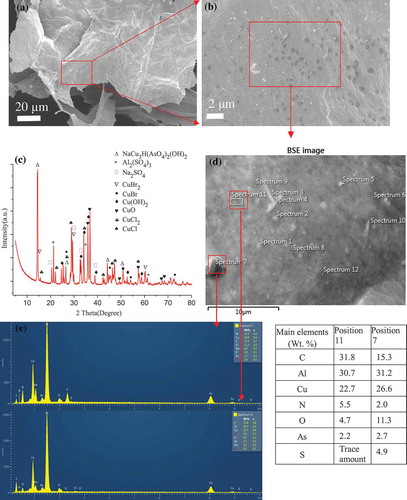
Figure 5. (a), (b) SEM images at different magnification, (c) XRD pattern, (d) backscattered electron (BSE) image, and (e) EDX spectra (the data in Table) obtained at positions 7 and 11 of freeze dried GOM-TH1 after adsorption of As(V) and Cu(II).
Supplemental material