Figures & data
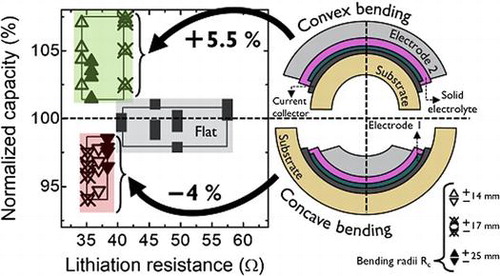
Figure 1. (a) Schematic representation of the flexible thin-film battery layers. (b) Top view representation of the layers showing the 7.25 cm2 active area (c) Top view photograph of a real flexible thin-film battery device. (d) Cross section representation of the fully encapsulated battery stack showing all final components.
Figure 2. (a) Cyclic voltammograms at a scanning rate of 10 mV s−1 for a thin-film all-solid-state flexible battery stack based on Li4Ti5O12/LiPON/Li at different bending states. Photographs of the flexible battery in the bending characterization apparatus on (b) a flat state (R c = ∞) and c) with curvature radius R c = 8.5 mm. (d) Schematic representation of the thin-film stack in convex and compressive bending state showing the mechanically neutral plane for both cases and the tensile and compressive strains.
Figure 3. (a) Volumetric capacity as a function of C-rate for the different bending states. Capacities of rigid batteries with various active areas are plotted as reference. (b) Normalized capacity as a function of lithiation resistance for the different bending states at the different C-rates. Squares, up-triangles, and down-triangles represent the flat state, convex and concave states, respectively. Filled, cross-centered and open triangles represent bending states with an R c value of 25, 17, and 14 mm, respectively. Squares represent the flat states measured before, in between, and after bending.
Table 1. Values of capacity change at convex and concave bending states with bending radii of R c = 25, 17, and 14 mm at different C-rates (1, 2, 5, and 10 C).
Figure 4. Relationship between the Li-diffusion energy barrier as a function of strain applied according to the simulation from [Citation14] (red circles and blue squares). The open black circles represent the average change in capacity obtained from our flexible thin-film battery bending experiments as a function of strain (stress).
![Figure 4. Relationship between the Li-diffusion energy barrier as a function of strain applied according to the simulation from [Citation14] (red circles and blue squares). The open black circles represent the average change in capacity obtained from our flexible thin-film battery bending experiments as a function of strain (stress).](/cms/asset/6ce0baec-49a9-47c3-901d-4ad0111c55c8/tsta_a_1468199_f0004_oc.gif)
Figure 5. (a) Flexible thin-film battery cycling before and after air exposure. Blue circles, green stars and red squares represent the cycling of a Li4Ti5O12-based flexible battery with (1) Al2O3 coating, (2) Al2O3 + PDMS, and (3) Al2O3 + thin glass sheet + PDMS encapsulation, respectively. (b) Photograph of the flexible thin-film battery at day 4 of air exposure working as a power source for an LED. (c) Top view photographs of a fully encapsulated battery (Al2O3 + thin glass + PDMS) showing the morphology changes of the Li-metal anode at 1, 4, and 9 days of air exposure.
Figure 6. (a) Cyclic voltammograms at a scanning rate of 10 mV s−1 for a thin-film all-solid-state flexible battery stack based on Li4Ti5O12/LiPON/Li at different exposure days to air. (b) Cell resistance and Li-metal anode oxidized surface area as a function of air exposure.