Figures & data
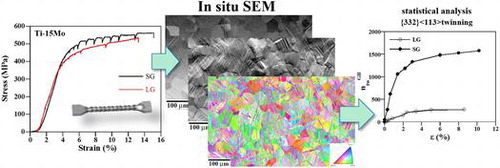
Figure 1. Scheme of the twin plane trace approach. (a): BSE-SEM image of the twin structure of the SG sample strained to 425 MPa/ε: 0.3%. (b)–(d): Example of twin plane analysis of grain A marked in (a). α exp: angle between surface twin plane trace and rolling direction; α cal: angle between rolling direction and trace projection of the twin plane onto the RD-TD plane; SF: Schmid factor.
Figure 2. Stress-strain curves of the tensile strained samples.
Figure 3. ϕ 2 = 45° ODF sections. (a) Annealed SG sample; (b) Annealed LG sample; (c) SG sample, ε: 8.1%; (d) LG sample, ε: 8.8%. (e) Drawing of the most relevant texture orientations in bcc metals located in the ϕ 2 = 45° ODF section.
Figure 4. BSE-SEM images of the evolution of {332}〈113〉 twin structure upon deformation in the SG sample. (a) 425 MPa/ε: 0.3%; (b) 495 MPa/ε: 1.4%; (c) 560 MPa/ε: 8.1%. (d) EBSD map along tensile direction. Sample deformed to 495 MPa/ε: 1.4%.
Figure 5. BSE-SEM images of the evolution of {332}〈113〉 twin structure upon deformation in the LG sample. (a) 380 MPa/ε: 0.3%; (b) 430 MPa/ε: 0.9%; (c) 530 MPa/ε: 8.8%. (d) EBSD map along tensile direction. Sample deformed to 530 MPa/ε: 8.8%.
Figure 6. Frequency of the apparent critical resolved shear stress τ c at which primary twins are nucleated and propagated in the SG an LG samples.
Figure 7. Twin number fraction as a function of the highest Schmid factor for twinning m(1) of the active twin variants in the SG (a) and LG sample (b), respectively.
Figure 8. Twin frequency of activated twin variants (v(1) … v(12)) in the SG (a) and LG samples (b), respectively.
Figure 9. Evolution of the number of twins n tw with plastic strain, ε, (a) and macroscopic stress, σ, (b).
Figure 10. Evolution of the number of twins per grain boundary area with plastic strain, ε.