Figures & data
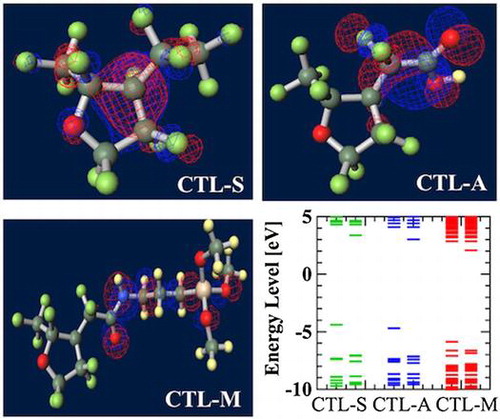
Figure 1. Schematic chemical structure of CYTOP polymers.
Figure 2. Infrared absorption spectra of CTL-S, CTL-A and CTL-M.
Figure 3. TSD spectra of CYTOP polymers.
Table 1. Surface charge density of negatively charged, 15 μm-thick amorphous fluropolymers [Citation11,12].
Figure 4. (a) Principle of the inverse photoelectron spectroscopy (LEIPS), (b) Schematic of the LEIPS measurement setup.
Figure 5. LEIPS results: (a) Intensity of emitted light from CTL-S with 0.15 μA of sample current, (b) Intensity of emitted light from CTL-S with 0.70 μA of sample current, (c) Thickness dependence of LEIPS onset energy for CTL-S, (d) Intensity of emitted light from CTL-A with 0.15 μA of sample current, (e) Intensity of emitted light from CTL-A with 0.70 μA of sample current, (f) Thickness dependence of LEIPS onset energy for CTL-A.
Figure 6. Influence of the external electrostatic field on electron affinity.
Figure 7. Ground-state structures of (a) PE, (b) PTFE, (c) PTFE, (d) CTL-S, (e) CTL-A, (f) CTL-M.
Figure 8. Strong electron-attracting characteristics of CTL-M end group.
Figure 9. Calculated orbital energy level of PTFE with different number of carbons.
Figure 10. Visualized distribution of the trapped electron in CYTOP monomers.
Figure 11. Calculated orbital energy level of polymer electrets.