Figures & data
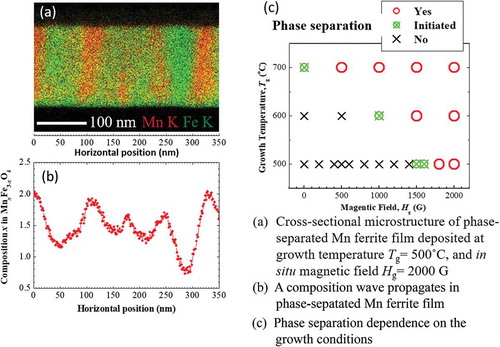
Figure 1. θ-2θ XRD patterns of Mn ferrite thin films with x = 1.45 deposited under different strength of magnetic field on MgO (001) substrate at 500 °C growth temperature.
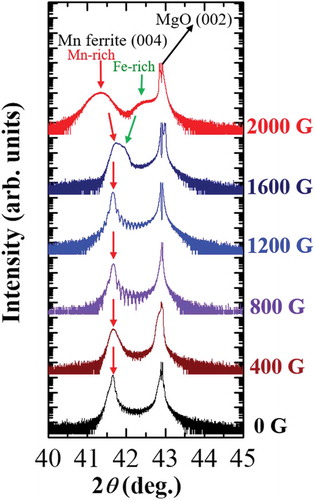
Figure 2. RSM images of (a) 0 G, (b) 1600 G, and (c) 2000 G Mn ferrite thin films around Mn ferrite 226 and MgO 113 diffraction conditions. The white dashed lines indicate in-plane matching to the substrate. Reciprocal spots for Mn ferrite films are marked by circular dashed lines which are determined by Q z values obtained from corresponding d-spacings of the XRD patterns.
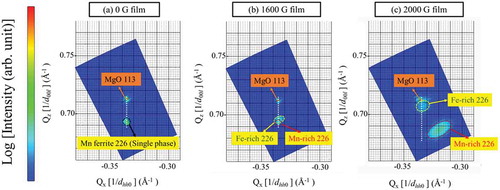
Figure 3. AFM surface morphology of (a) 0 G, (b) 2000 G Mn ferrite thin films, and bright-field (BF) cross-sectional TEM images of (c) 0 G, (d) 2000 G Mn ferrite films, and (e) a schematic of the phase-separated 2000 G Mn ferrite film.
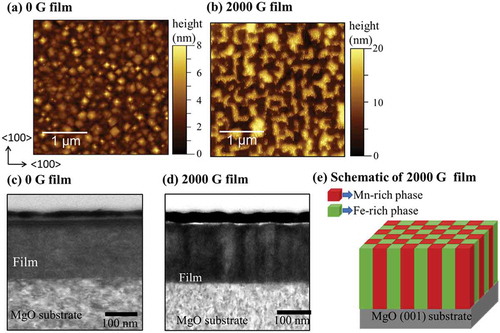
Figure 4. Cross-sectional STEM image and corresponding EDS elemental maps of Mn K, Fe K, and O K signals for (a) 0 G and (b) 2000 G Mn ferrite films, where Mn, Fe, and O elements are represented as red, green, and cyan colors, respectively.
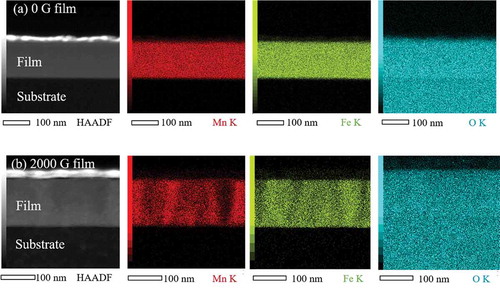
Figure 5. (a) Superimposed STEM-EDS maps of Mn K and Fe K in the 2000 G film shown in ). (b) Line-profile of composition x in Mn x Fe3-x O4 of 2000 G Mn ferrite film as a function of horizontal position in EDS maps of (a). The composition at each horizontal position is obtained using both Mn K and Fe K intensities which are averaged along the vertical direction. The black dashed line indicates the average composition of 2000 G Mn ferrite film determined from XRF measurement.
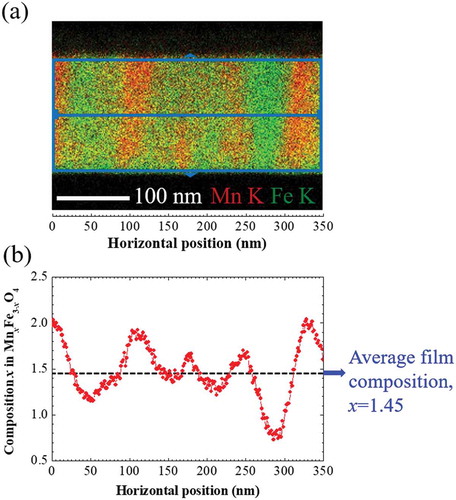
Figure 6. Phase separation in Mn ferrite films as a function of the growth temperature and magnetic field applied during the film growth. Red open circles, green crossed circles, and black crosses indicate that the phase separation was confirmed, initiated, and not observed, respectively. The boundary between the phase-separated and non-separated system is indicated by the blue dashed line.
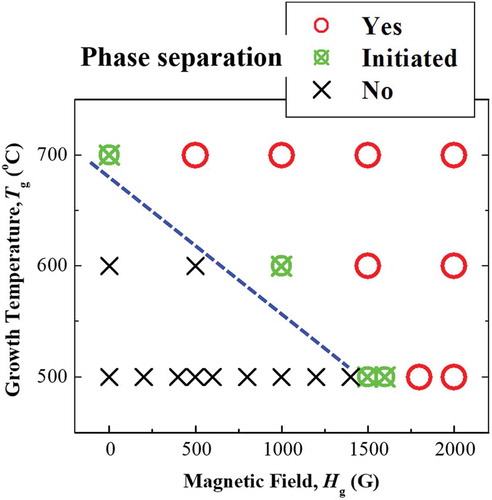
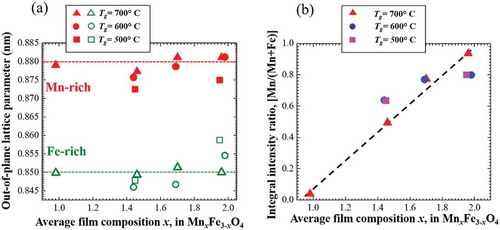
Figure 7. (a) Out-of-plane lattice parameters and (b) integral XRD intensity ratios of Mn-rich and Fe-rich phases in 2000 G Mn ferrite films of different composition deposited at different T g. In (a), the red and green dashed lines imply the lattice parameter of compositions at Mn-rich and Fe-rich sides on spinodal line in MnFe2O4-Mn3O4 system, respectively. In (b), the black dashed line is used to guide the reader’s eyes.