Figures & data
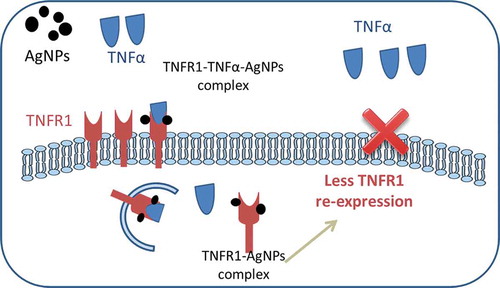
Figure 1. Effect of AgNPs and TNFα on the viability of NCI-H292 cells. (A) The viability of cells exposed to AgNPs at concentrations of 0, 5, 10, 25, 50, 75, and 100 µg/mL. (B) The viability of cells exposed to TNFα at concentrations of 0, 10, 20, and 40 ng/mL. Cells were exposed to AgNPs and TNFα for 24 h, then cell viability was determined using a CellTiter-Glo® luminescent cell viability assay. The results are shown as mean ± SD, n ≥ 3, for each group; *0.01 < P < 0.05 and ** P < 0.01. * Represents significant difference compared to the control group.
Figure 2. Effect of TNFα on the cellular uptake of AgNPs. (A) Percentage of cells incorporating AgNPs after exposure to 2.5, 5, 10, and 20 µg/mL of AgNPs. (B) Percentage of cells incorporating AgNPs after exposure to AgNPs (5 µg/mL) with and without TNFα (20 ng/mL). Cells were exposed to AgNPs and TNFα for 24 h, then cellular uptake was determined based on side scatter (SSC) using FACS. The results are shown as mean ± SD, n ≥ 3, for each group; *0.01 < P < 0.05.
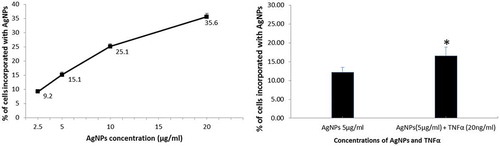
Figure 3. Effect of AgNPs and TNFα on apoptosis in NCI-H292 cells. (A) Percentage of apoptotic cells following 24 h exposure to AgNPs (5 µg/mL) only, TNFα (20 ng/mL) only, or both AgNPs (5 µg/mL) and TNFα (20 ng/mL) together as compared to control cells. Data were obtained by FACS measurements. (B) Representative quadrant diagrams for NCI-H292 cells exposed to AgNPs (5 µg/mL) and/or TNFα (20 ng/mL) for 24 h and stained using an Annexin V-FITC apoptosis detection kit. The samples were analyzed using FACS. The results are shown as mean ± SD, n ≥ 3, for each group; ** and ## means P < 0.01. ## Represents significant difference compared to the control group. ** represents significant difference compared to the marked corresponding group. (+) means with, (−) means without.
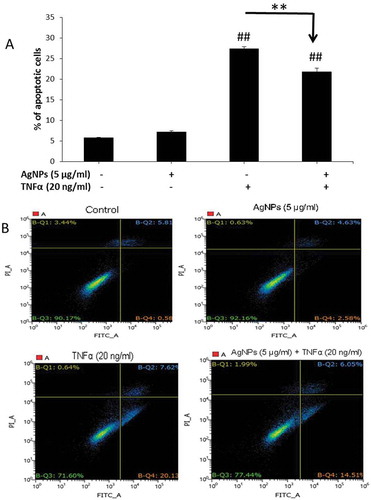
Figure 4. Effect of AgNPs and TNFα on IL-17c gene expression. NCI-H292 cells were exposed to AgNPs (5 µg/mL) and/or TNFα (20 ng/mL) for 24 h. IL-17c mRNA expression was measured using a real-time (RT) PCR technique. The results are shown as mean ± SD, n ≥ 3, for each group; ** P < 0.01 and represents significant difference compared to the marked corresponding group.
Figure 5. Localization of TNFR1 in NCI-H292 cells using a confocal microscope. Blue shows the nucleus, green shows the receptor (TNFR1), and blue and green together are the merged form. White arrows show TNFR1. (A) The control NCI-H292 cells, without exposure to AgNPs or TNFα, showing that TNFR1 is homogenously distributed on the cell membrane. (B) The NCI-H292 cells exposed to TNFα (20 ng/mL) for 24 h, showing that TNFR1 is slightly aggregated and scattered over the entire cell membrane. (C) The NCI-H292 cells exposed to both TNFα (20 ng/mL) and AgNPs (5 µg/mL) for 24 h, showing that TNFR1 localizes inside the cells, with very few receptors scattered on the cell membrane. Scale bar is 10 µm for all panels.
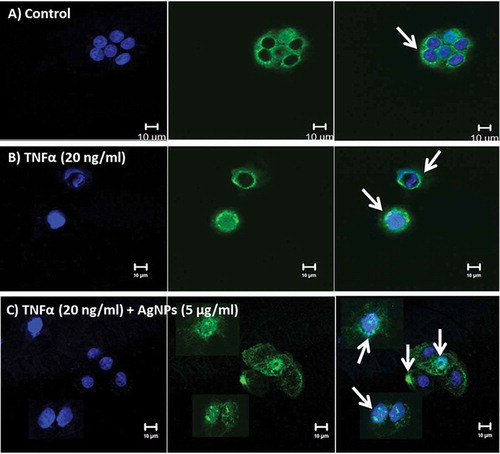
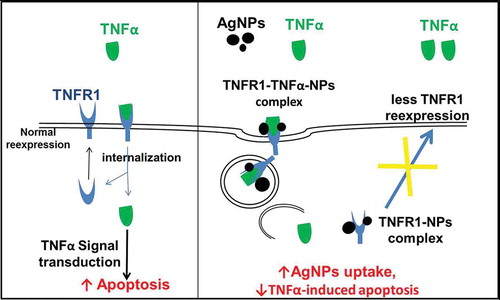
Figure 6. Molecular mechanism explaining why the cellular uptake of AgNPs increases in the presence of TNFα, and how the AgNPs reduce the apoptosis induced by TNFα.