
Figures & data
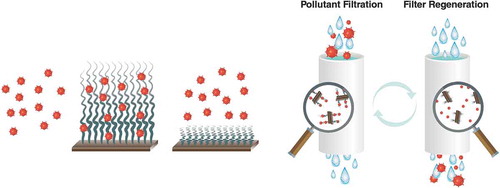
Figure 1. Schematic of the preparation of the grafted PVP montmorillonite composite (GPC).
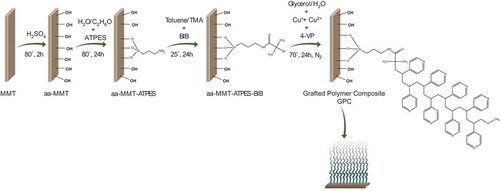
Figure 2. High-resolution XPS measurements of N, C and Br binding energies in aa-MMT–ATPES, aa-MMT–ATPES–BIB and GPC (top to bottom).
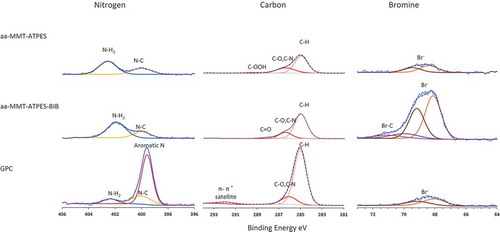
Figure 3. Thermal gravimetric analysis of MMT, aa-MMT–ATPES, APC and GPC.
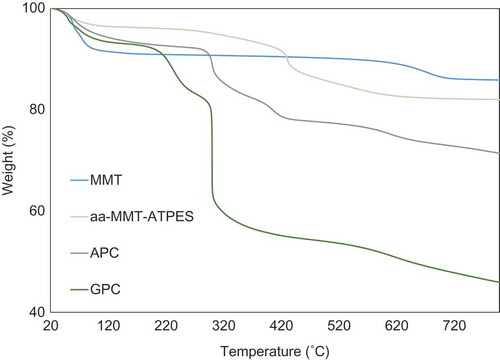
Figure 4. (a) FTIR spectra of APC and GPC at pH 3 and 11. (b) GPC and APC zeta potential as function of suspension pH. (c) Photographs of GPC and APC suspensions at pH 3, 6 and 10.
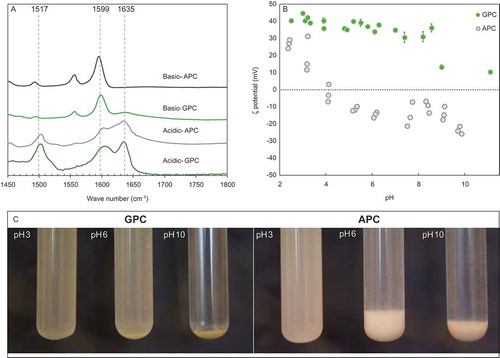
Figure 5. Filtration of (a) selenate (0.2 mM) or (b) eosin-Y (0.1 mM) through columns of APC or GPC (mixed with sand) presented as emerging pollutant concentrations (C/Co) as a function of the number of column pore volumes.
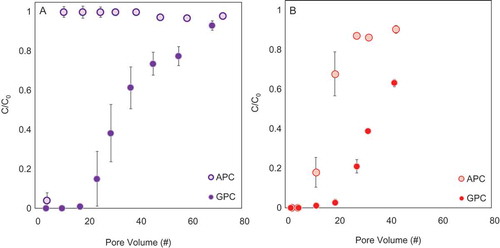
Figure 6. GPC suspension at pH 3, GPC (after centrifugation) with eosin-Y adsorbed at pH 3 and desorbed at pH 10.
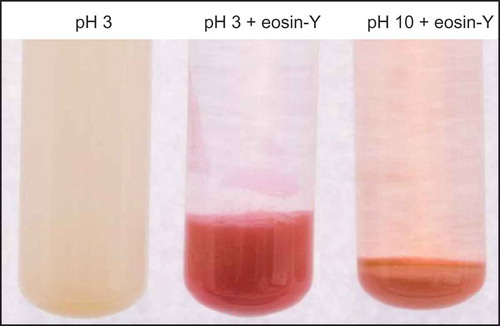
Figure 7. The accumulated amount of (a) selenate (0.16 mM) and (b) eosin-Y (0.04 mM) on GPC as a function of the number of pore volumes filtrated through the column. Dashed lines indicate a change in the feed solution pumped through the columns.
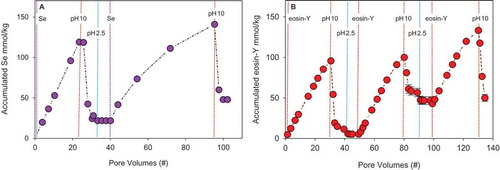
Table 1. Pollutant chemical properties at pH 3 and 10 [Citation53], as well as the percent of adsorbed pollutant to GPC (0.01 mmol pollutant; 1 g GPC) at pH 3 and the amount desorbed at pH 10.