Figures & data
Figure 1. (a) Schematic of the separation of s-SWNTs from as-received mixture by conjugated polymers. (b) Absorption spectra of s-SWNTs dispersed by PF12 in toluene (brown line) and by SDOC in D2O (grey line). (c) Height profiles of transferred films on PET substrates. The inset photograph shows the reddish brown PF12/SWNT-320 film on PET. (d) Absorption spectra of an s-SWNT film in the UV-Vis-NIR (brown) and NIR-MIR (pale red) regions. A pale blue line shows the MIR spectra of a SDOC-dispersed film as a reference. Sharp background spikes (*) in the MIR region (0.09–0.22 eV) are derived from the vibration modes of PET.
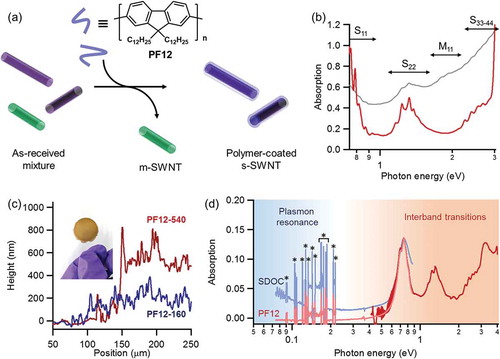
Figure 2. (a) Absorption spectra of PF12/s-SWNT-340 before and after doping with AgTFSI up to 8 mg mL−1 in butanol. (b) Evolution of plasmon resonance (PR) band as a function of AgTFSI concentration for 220 nm-, 300 nm-, and 340 nm-thick PF12/s-SWNT films. The PR intensity at 0.1 eV is normalized by the initial S11 peak at 0.8 eV.
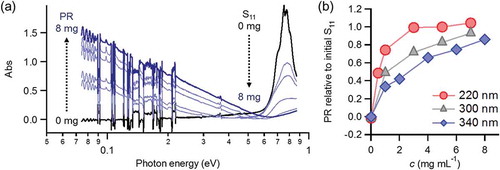
Figure 3. Thermoelectric properties of (a) PF12/s-SWNT-160, (b) PF12/s-SWNT-300, and (c) PF12/s-SWNT-540 after AgTFSI doping with different concentration. (d) Optimized power factors as a function of film thickness.
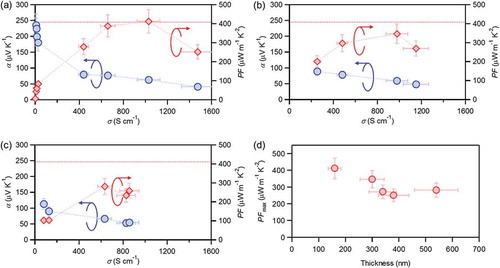
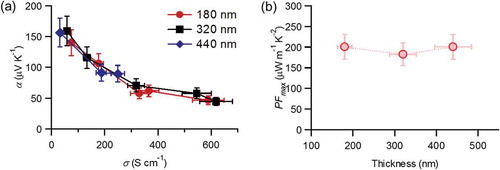
Figure 4. (a) Thermoelectric properties of P3DT/s-SWNT-180, P3DT/s-SWNT-320, and P3DT/s-SWNT-440. (b) Optimized power factors as a function of film thickness.