Figures & data
Figure 1. The process-structure-property-performance reciprocity.
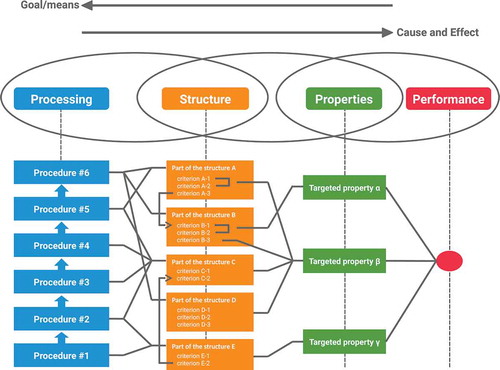
Figure 2. Sentences containing noun phrases.
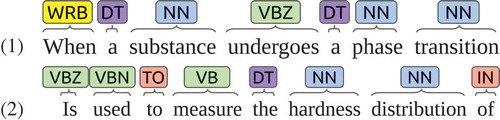
Table 1. Samples of factors obtained by the linguistic rules.
Table 2. Hyper-parameters of the CNN model.
Table 3. Factors in the relationship data.
Table 4. Relations in the relationship data.
Figure 3. Structure of the CNN model. The convolutional layers embed a sentence, and the max pooling and two fully connected layers give a binary probability distribution with a sigmoid function.
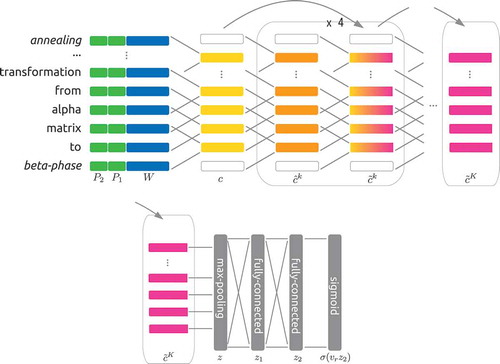
Figure 4. Precision-recall curve of the logistic regression model. The features are ‘bag of words’, ‘bag of words + stop word removal’ and ‘bag of unigram + bigram + trigram’.
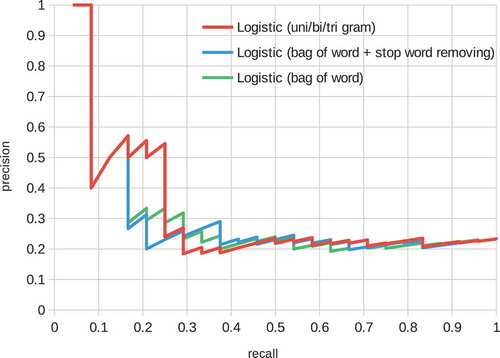
Figure 5. Precision-recall curve of the SVM model. The features are ‘bag of words’, ‘bag of words + stop word removal’ and ‘bag of unigram + bigram + trigram’.
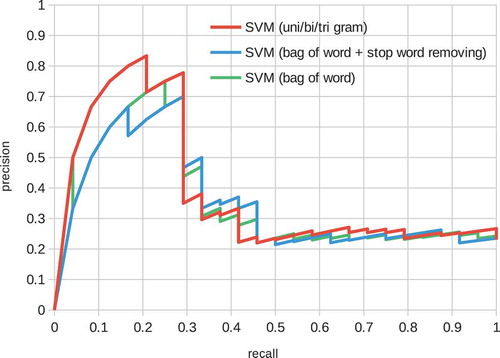
Figure 6. Precision-recall curve over the relationship data of the CNN model.
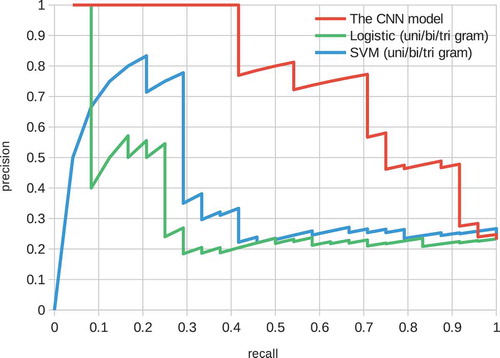
Table 5. Sample representative sentences scored by the CNN model. Label P indicates that the factors are positively related in the test relationship data and label N indicates a negative relation. Factors in each sentence are underlined. The score is the of each sentence. See Appendix for the source articles.
Appendix. Source articles.
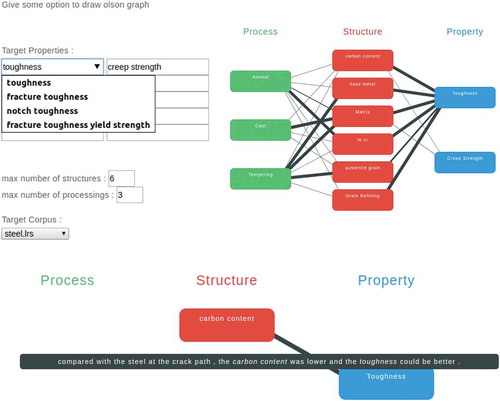
Figure 7. The end-to-end demo system. a) Desired properties and a base material were selected. b) A sample of the generated PSPP design chart. The desired properties were toughness and creep strength, and ‘steel’ was selected as base material. c) The representative sentence describing the relation between toughness and carbon content.