
Figures & data
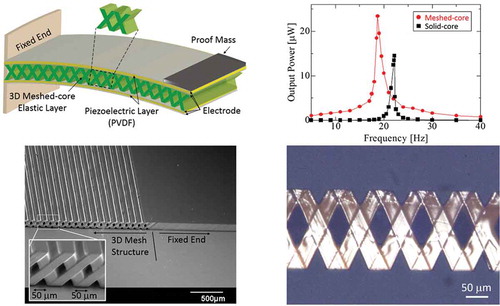
Figure 1. Schematic of the proposed PVEH with 3D meshed-core structure (10 mm × 21 mm × 280 μm).
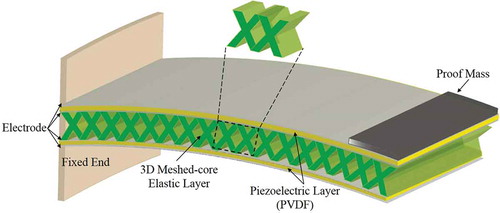
Table 1. Dimensions of the proposed PVEH. The subscripts p and e indicate a piezoelectric material and an elastic layer, respectively.
Table 2. Parameters of FEM analysis.
Figure 2. Schematic of a FEM structural analysis model. In the meshed-core structure, the line length L and line spacing S satisfy the relation L + S = 100 μm.
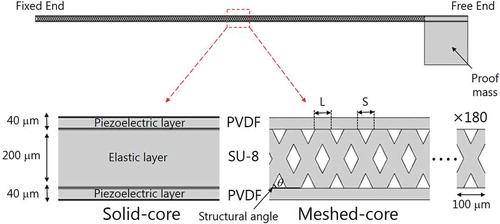
Figure 3. Volume void fraction and normalized bending stiffness as a function of line spacing of the meshed-core structure. The normalized bending stiffness is calculated by dividing the bending stiffness of a harvester with the meshed-core elastic layer by that of a harvester with a solid-core elastic layer.
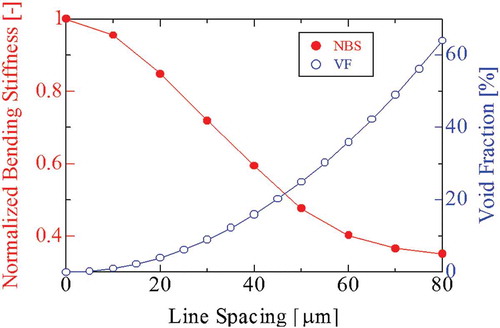
Figure 4. FEM result of maximum output power as a function of vibration frequency under each optimum load resistance (meshed-core 17 MΩ, solid-core 13 MΩ), and 0.2 G acceleration.
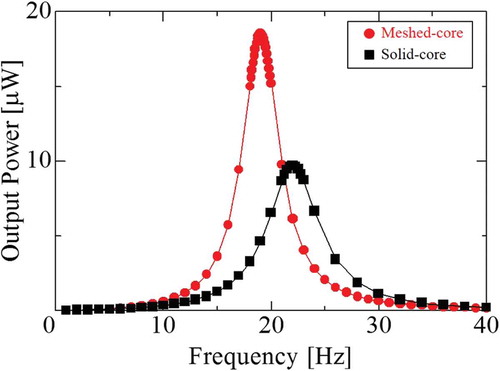
Figure 5. Fabrication process of bimorph meshed-core harvester.
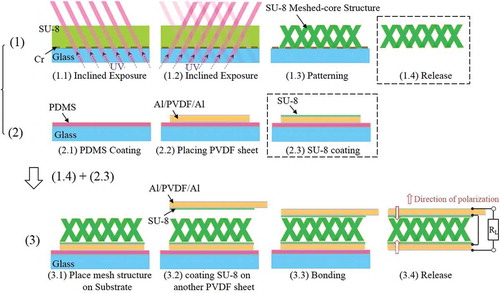
Figure 6. Optical path regarding the inclined exposure.
Figure 7. (a) SEM image of SU-8 meshed-core elastic layer and (b) optical image of 3D meshed-core structure.
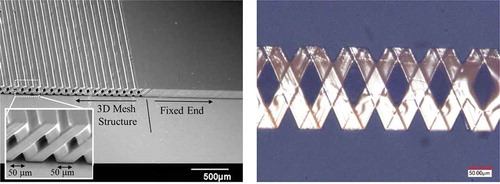
Figure 8. Photograph of fabricated bimorph meshed-core vibration energy harvester.
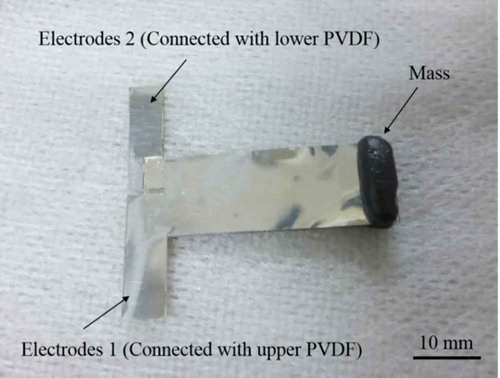
Figure 9. (a) Experimental setup and (b) evaluation system for PVEH.
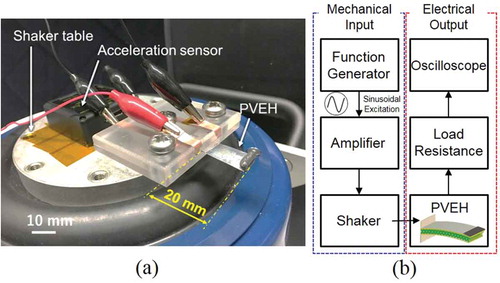
Figure 10. Sinusoidal measured voltage of load resistance under each resonance condition (meshed-core 18.7 Hz, solid-core 22.2 Hz), optimum load resistance (meshed-core 17 MΩ, solid-core 13 MΩ), and 0.2 G acceleration.
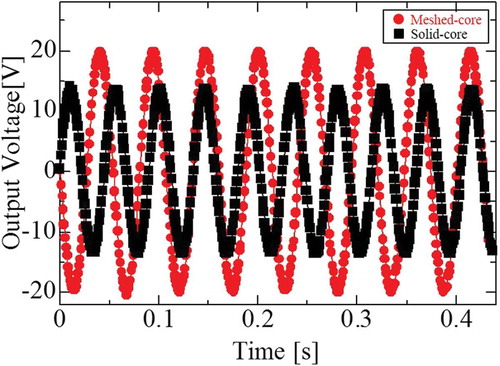
Figure 11. Maximum output power as a function of load resistance under each resonance condition (meshed-core 18.7 Hz, solid-core 22.2 Hz) and 0.2 G acceleration.
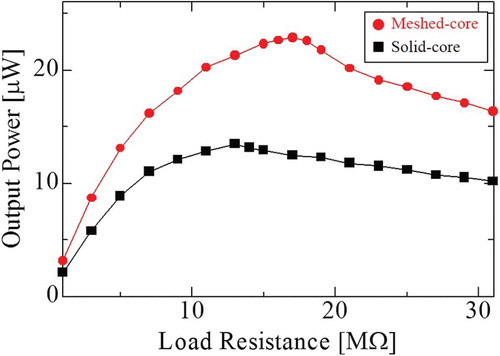
Figure 12. Maximum output power as a function of vibration frequency under each optimum load resistance (meshed-core 17 MΩ, solid-core 13 MΩ) and 0.2 G acceleration.
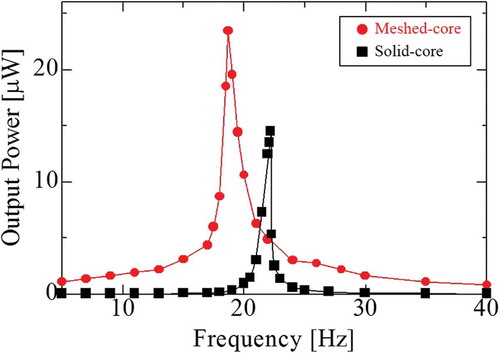
Table 3. Experimental results of meshed- and solid-core PVEHs.