
Figures & data
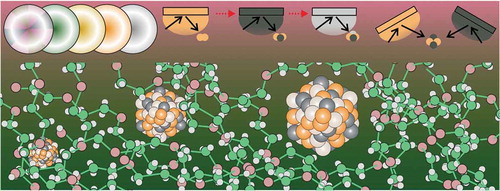
Figure 1. Vacuum sputtering onto different liquids to produce metal NPs/NCs. The design of target and the sputter sequence are used for obtaining bimetallic/trimetallic NPs/NCs with desired fine structures. The liquids and solid additives/ligands, for example MUTAB, allow for trapping and stabilizing NPs/NCs in the liquids.
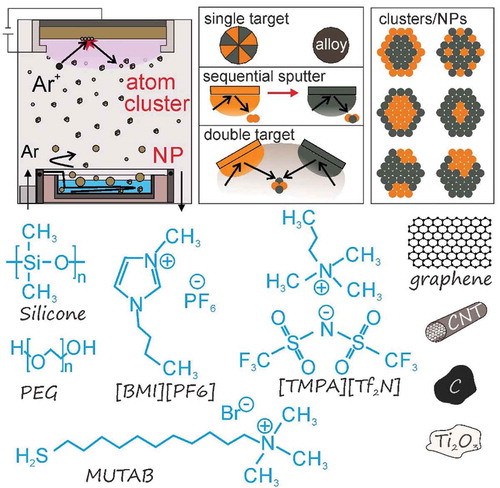
Figure 2. (a) Schematic illustrations of Au/Pt foil binary targets having various f Au, f Au = AAu/(AAu + APt), where AAu and APt are total areas of Au and Ag parts exposed on the targets, respectively. (b) Relationship between the proportion of Au (%) in NPs obtained by sputter deposition on IL and f Au of the binary targets. Reproduced with permission from Ref. [Citation95], copyright 2012 The Royal Society of Chemistry.
![Figure 2. (a) Schematic illustrations of Au/Pt foil binary targets having various f Au, f Au = AAu/(AAu + APt), where AAu and APt are total areas of Au and Ag parts exposed on the targets, respectively. (b) Relationship between the proportion of Au (%) in NPs obtained by sputter deposition on IL and f Au of the binary targets. Reproduced with permission from Ref. [Citation95], copyright 2012 The Royal Society of Chemistry.](/cms/asset/111a2235-8e56-4e7f-93ae-630221f3a9c8/tsta_a_1542926_f0002_b.gif)
Figure 3. Au/Ag NPs via vacuum sputtering in combination with chemical reduction: UV-Vis spectra of Au/Ag NPs with different concentration of HAuCl4 in IL 0 (a), 50 (b), 65 (c), 100 (d) µmol dm−3. Inset is the relation between UV-Vis peak position and concentration of HAuCl4. TEM images (e) and (f) show Au/Ag NPs with UV-Vis spectra in (c) and (d) respectively. (g) Au/Ag composite prepared in sputtering and used as intermediate for controlling structure of Au nanoframe. SAM stands for self-assembled monolayer, ODT for 1-octadecanethiol and AMP for 4-amino-2-mercaptopyrimidine. Reproduced with permission from (a-f) Ref. [Citation98], copyright 2009 The Electrochemical Society of Japan, and (g) Ref. [Citation99], copyright 2011 The Chemical Society of Japan.
![Figure 3. Au/Ag NPs via vacuum sputtering in combination with chemical reduction: UV-Vis spectra of Au/Ag NPs with different concentration of HAuCl4 in IL 0 (a), 50 (b), 65 (c), 100 (d) µmol dm−3. Inset is the relation between UV-Vis peak position and concentration of HAuCl4. TEM images (e) and (f) show Au/Ag NPs with UV-Vis spectra in (c) and (d) respectively. (g) Au/Ag composite prepared in sputtering and used as intermediate for controlling structure of Au nanoframe. SAM stands for self-assembled monolayer, ODT for 1-octadecanethiol and AMP for 4-amino-2-mercaptopyrimidine. Reproduced with permission from (a-f) Ref. [Citation98], copyright 2009 The Electrochemical Society of Japan, and (g) Ref. [Citation99], copyright 2011 The Chemical Society of Japan.](/cms/asset/173ca261-7354-4632-9a3b-71b6626b1067/tsta_a_1542926_f0003_b.gif)
Figure 4. Sequential sputtering of metal targets A and B onto an ionic liquid containing support materials, i.e., graphene to produce bimetallic NPs. The resulting NPs with Ag core and Au or Pd shell are shown in (a–f). TEM images (a–c) of graphene supported Ag@Au core@shell NPs. The lattice spacing shown in (c) corresponds to (111) of Au and Ag. TEM images (d,e) and HR-TEM image (f) of Ag@Pd core@shell NPs. The presence of both Ag and Pd on the shell indicates the local alloying of Ag and Pd. Reproduced with permission from Ref. [Citation101], copyright 2013 The American Chemical Society.
![Figure 4. Sequential sputtering of metal targets A and B onto an ionic liquid containing support materials, i.e., graphene to produce bimetallic NPs. The resulting NPs with Ag core and Au or Pd shell are shown in (a–f). TEM images (a–c) of graphene supported Ag@Au core@shell NPs. The lattice spacing shown in (c) corresponds to (111) of Au and Ag. TEM images (d,e) and HR-TEM image (f) of Ag@Pd core@shell NPs. The presence of both Ag and Pd on the shell indicates the local alloying of Ag and Pd. Reproduced with permission from Ref. [Citation101], copyright 2013 The American Chemical Society.](/cms/asset/c38a1285-1cd1-42ca-82a7-f3dd655e653b/tsta_a_1542926_f0004_oc.jpg)
Figure 5. Graphene-supported Pd/Au alloy NPs by sequential sputtering of Pd followed by Au: (a) TEM image and EDX spectrum, (b) HR-TEM image, (c) HAADF and crossline profile, (d) UV-Vis spectra of Pd/Au with different Pd-to-Au ratios, and (e) bimetallic composition tuning of Pd/Au NPs. (f) Sequential sputtering of Au followed by Pt to form monolayer of Au core@Au/Pt alloy shell NPs functionalized on IL. Reproduced with permission of (a-e) Ref. [Citation102], copyright 2015 The Royal Society of Chemistry, and (f) Ref. [Citation104], copyright 2016 The American Chemical Society.
![Figure 5. Graphene-supported Pd/Au alloy NPs by sequential sputtering of Pd followed by Au: (a) TEM image and EDX spectrum, (b) HR-TEM image, (c) HAADF and crossline profile, (d) UV-Vis spectra of Pd/Au with different Pd-to-Au ratios, and (e) bimetallic composition tuning of Pd/Au NPs. (f) Sequential sputtering of Au followed by Pt to form monolayer of Au core@Au/Pt alloy shell NPs functionalized on IL. Reproduced with permission of (a-e) Ref. [Citation102], copyright 2015 The Royal Society of Chemistry, and (f) Ref. [Citation104], copyright 2016 The American Chemical Society.](/cms/asset/569c5f66-afd6-43d6-9def-813579bdd139/tsta_a_1542926_f0005_oc.jpg)
Figure 6. HAADF-STEM images and profiles of elemental composition for graphene-supported AuPd alloy NPs prepared using single targets and different Au:Pd ratios: (a) for 3:1; (b) for 1:1; and (c) for 1:3. Reprinted with permission from Ref. [Citation108], copyright Elsevier 2016.
![Figure 6. HAADF-STEM images and profiles of elemental composition for graphene-supported AuPd alloy NPs prepared using single targets and different Au:Pd ratios: (a) for 3:1; (b) for 1:1; and (c) for 1:3. Reprinted with permission from Ref. [Citation108], copyright Elsevier 2016.](/cms/asset/28b0dc8e-b38b-4605-a53d-5152f5634f24/tsta_a_1542926_f0006_oc.jpg)
Figure 7. (a) Sequential sputtering of PdAu alloy and Pt targets onto room-temperature (RT) IL, [BMI][BF4], containing a carbon nanotube (CNT) to form PdAu/Pt trimetallic NPs-decorated CNT, (b) the HAADF and elemental mapping of CNTs-supported PdAu/Pt trimetallic NPs, (c) Pt L 3 edge XANES spectra of CNTs-supported PdAu/Pt trimetallic NPs with different Pd/Au/Pt ratios, Au/Pt and Pd/Pt bimetallic NPs, and Pt NPs. Reproduced with permission from Ref. [Citation110], copyright 2017 Springer.
![Figure 7. (a) Sequential sputtering of PdAu alloy and Pt targets onto room-temperature (RT) IL, [BMI][BF4], containing a carbon nanotube (CNT) to form PdAu/Pt trimetallic NPs-decorated CNT, (b) the HAADF and elemental mapping of CNTs-supported PdAu/Pt trimetallic NPs, (c) Pt L 3 edge XANES spectra of CNTs-supported PdAu/Pt trimetallic NPs with different Pd/Au/Pt ratios, Au/Pt and Pd/Pt bimetallic NPs, and Pt NPs. Reproduced with permission from Ref. [Citation110], copyright 2017 Springer.](/cms/asset/422d2548-628b-42f1-9bab-b47b5fcfbe89/tsta_a_1542926_f0007_oc.jpg)
Figure 8. Upper left: schematic (not to scale) of the combinatorial co-deposition from two sputter targets into a cavity array substrate filled with IL. Upper right: Schematic of the proposed formation process of NPs in IL. Lower left: photo of a 4-in cavity array substrate used for the fabrication of NP libraries synthesized by method described in the upper left Figure. The red dots mark the measurement points whereas the red arrow shows the direction in which the EDX line scan analysis was performed. Lower right: results of EDX screening for the four materials libraries. Adapted from Ref. [Citation111]. Copyright 2014 John Wiley & Sons Ltd.
![Figure 8. Upper left: schematic (not to scale) of the combinatorial co-deposition from two sputter targets into a cavity array substrate filled with IL. Upper right: Schematic of the proposed formation process of NPs in IL. Lower left: photo of a 4-in cavity array substrate used for the fabrication of NP libraries synthesized by method described in the upper left Figure. The red dots mark the measurement points whereas the red arrow shows the direction in which the EDX line scan analysis was performed. Lower right: results of EDX screening for the four materials libraries. Adapted from Ref. [Citation111]. Copyright 2014 John Wiley & Sons Ltd.](/cms/asset/5e07363b-c738-4a7a-a584-8d12dac54cbf/tsta_a_1542926_f0008_oc.jpg)
Figure 9. (a) LSPR peak maxima versus Au content measured by EDX in alloy NPs synthesized by independently varying the sputter current of each metal target. Numbers in the figure indicate the sputtering current for each target in mA. (b) EDX mapping for several single plasmonic Au/Ag alloy NPs. (c) EDX mapping for Au/Cu NPs prepared using double-target sputtering. Reproduced with permission from (a and b) Ref. [Citation117], copyright 2016 Elsevier, and (c) Ref. [Citation118], copyright 2017 The American Chemical Society.
![Figure 9. (a) LSPR peak maxima versus Au content measured by EDX in alloy NPs synthesized by independently varying the sputter current of each metal target. Numbers in the figure indicate the sputtering current for each target in mA. (b) EDX mapping for several single plasmonic Au/Ag alloy NPs. (c) EDX mapping for Au/Cu NPs prepared using double-target sputtering. Reproduced with permission from (a and b) Ref. [Citation117], copyright 2016 Elsevier, and (c) Ref. [Citation118], copyright 2017 The American Chemical Society.](/cms/asset/613d20cd-539a-4afc-a8a2-53aae4f53bb3/tsta_a_1542926_f0009_oc.jpg)
Table 1. Summary of multi-metallic NPs obtained via sputtering onto a liquid.
Figure 10. (a) Cyclic voltammograms of AuPd nanoparticle-immobilized HOPG electrodes (solid lines: the positive potential scan, dotted lines: the negative potential scan). The value of fAu used for the preparation of AuPd particles is shown in panel a. (b and c) Plots of peak current density (b) and onset potential (c) observed in the positive potential scan as a function of fAu. The values for a bulk Pt electrode are shown by dashed lines. (d) enhanced stability and ethanol oxidation electro-catalytic activity of AuPd alloy with Au: Pd = 1: 3 mol/mol compared with other compositions and single metallic Pd. Reproduced with permission from (a–c) Ref. [Citation96], copyright The Royal Society of Chemistry 2013 and (d) Ref. [Citation108], copyright Elsevier 2016.
![Figure 10. (a) Cyclic voltammograms of AuPd nanoparticle-immobilized HOPG electrodes (solid lines: the positive potential scan, dotted lines: the negative potential scan). The value of fAu used for the preparation of AuPd particles is shown in panel a. (b and c) Plots of peak current density (b) and onset potential (c) observed in the positive potential scan as a function of fAu. The values for a bulk Pt electrode are shown by dashed lines. (d) enhanced stability and ethanol oxidation electro-catalytic activity of AuPd alloy with Au: Pd = 1: 3 mol/mol compared with other compositions and single metallic Pd. Reproduced with permission from (a–c) Ref. [Citation96], copyright The Royal Society of Chemistry 2013 and (d) Ref. [Citation108], copyright Elsevier 2016.](/cms/asset/eff0e558-16a4-4f22-ac8d-1271264d8ce7/tsta_a_1542926_f0010_oc.jpg)
Figure 11. CV curves for the methanol oxidation reaction using: (a) CNTs-PdAu/Pt (3:1:2) NPs, Pd/Pt and Au/Pt bimetallic NPs, and a commercial Pt/C catalyst, and (b) CNTs-PdAu/Pt trimetallic NPs with different Pd/Au/Pt ratios. The durability (500 cycles) of the oxidation peak current for (c) samples shown in a; and (d) samples shown in b. Reproduced with permission from Ref. [Citation110], copyright 2017 Springer.
![Figure 11. CV curves for the methanol oxidation reaction using: (a) CNTs-PdAu/Pt (3:1:2) NPs, Pd/Pt and Au/Pt bimetallic NPs, and a commercial Pt/C catalyst, and (b) CNTs-PdAu/Pt trimetallic NPs with different Pd/Au/Pt ratios. The durability (500 cycles) of the oxidation peak current for (c) samples shown in a; and (d) samples shown in b. Reproduced with permission from Ref. [Citation110], copyright 2017 Springer.](/cms/asset/5b992c52-3b7d-4dab-b25f-8f89f8870c20/tsta_a_1542926_f0011_oc.jpg)
Figure 12. Correlation between the emission energies and the atomic percentage of Ag in positively charged Au/Ag NCs determined by XPS. Reproduced with permission from Ref. [Citation119], copyright 2017 The American Chemical Society.
![Figure 12. Correlation between the emission energies and the atomic percentage of Ag in positively charged Au/Ag NCs determined by XPS. Reproduced with permission from Ref. [Citation119], copyright 2017 The American Chemical Society.](/cms/asset/ec7d6c1f-fdce-4343-84fb-0ecceba2dffd/tsta_a_1542926_f0012_b.gif)