Figures & data

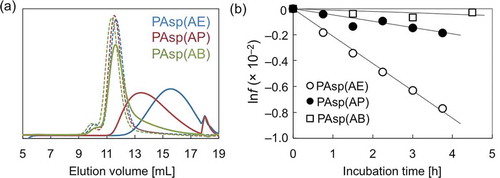
Figure 1. (a) SEC chart showing PAsp(AE), PAsp(AP), and PAsp(AB) before (dotted line) and after incubation for 24 h (solid line) under the physiological condition (pH 7.4, 37 °C); (b) lnf of PAsp(AE) (○), PAsp(AP) (●), and PAsp(AB) (□) plotted against incubation time.
Scheme 1. Mechanisms of (a) main chain cleavage of PAsp(DET) and (b) asparagine deamidation.
Scheme 2. Synthesis of PAsp(AE), PAsp(AP), and PAsp(AB) by aminolysis of PBLA with corresponding diamino compounds.
Table 1. Cleavage rate constant (k) [h–1] and T [h] of PAsp(R)s.
Figure 2. (a) Expected conformational changes in the side chain of PAsp(AE); and (b) expected ring-like conformations in the side chain of PAsp(R) series and the stabilization tendency are shown.
Figure 3. α/pH curves of PAsp(AE) (○), PAsp(AP) (●), and PAsp(AB) (□).
Figure 4. (a) lnf of PAsp(AE) at different pH values; (b) changes in cleavage rate constant (k) as a function of the degree of deprotonation of the primary amines in the side chains of PAsp(AE) (○), PAsp(AP) (●), and PAsp(AB) (□).
Figure 5. Viability of Huh-7 cells after 48 h incubation with (a) PAsp(AE), (b) PAsp(AP), and (c) PAsp(AB) at varying concentrations. Each PAsp(R) was pre-incubated for 0 or 48 h at 37 °C and pH 7.4. Results are expressed as mean ± SD (n = 5). The data were statistically analyzed by Student’s t-test in Microsoft Excel (*p < 0.0005).
Figure 6. (a) Size distribution histograms of mRNA-loaded PICs prepared from PAsp(AE) (○), PAsp(AP) (●), and PAsp(AB) (□); and (b) changes in SLI of mRNA-loaded PICs after 0 h (white bar), 24 h (gray bar), and 48 h (black bar) incubation at 37 °C and pH 7.4. Results are expressed as mean ± SD (n = 3).
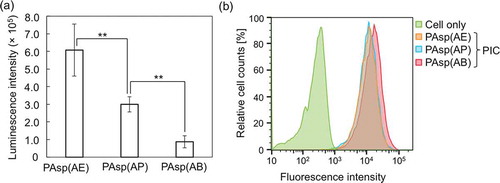
Figure 7. (a) GLuc mRNA expression level in cultured Huh-7 cells treated with GLuc mRNA-loaded PICs. Results are expressed as mean ± SD (n = 5). The data were statistically analyzed by an analysis of variance, followed by Tukey’s post hoc test (**p < 0.01). (b) Flow cytometry peaks showing cellular uptake of Cy5-mRNA-loaded PICs in cultured Huh-7 cells. In both experiments, 250 ng of GLuc mRNA was transfected to Huh-7 cells for 24 h.