
Figures & data
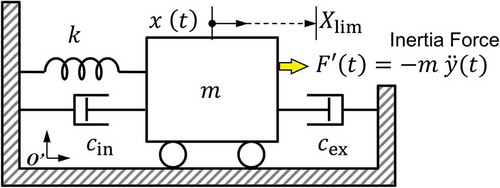
Table 1. Typical power demand of recent microelectronics.
Figure 1. Analytical model for the velocity damped resonance generator (VDRG). (a) Initial model in an inertia system O, where the shell mass should be considered to indirectly excite the suspended mass
. (b) Simplified model in a non-inertia frame Oʹ, where the suspended mass is driven by the inertia force. (c) Equivalent circuit model with a current source.
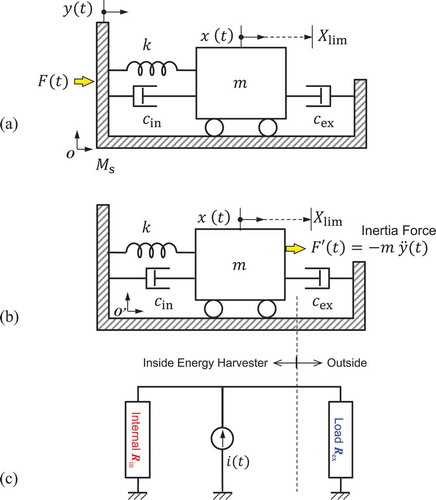
Figure 2. Frequency responses of the oscillator angle and phase calculated at different values of damping. Frequency is normalized to the eigen frequency.
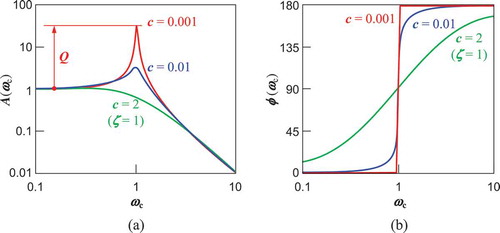
Figure 3. Schematic diagram of the power flow through a VDRG.
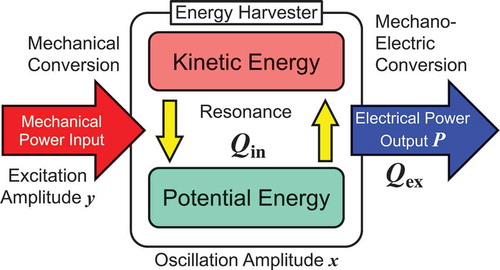
Figure 4. Power leverage factor calculated as a function of the internal and external quality factors when the oscillation is not limited. (a) Contour plot and (b) 3D plot. Output power is enhanced when
and
are equally maximized.
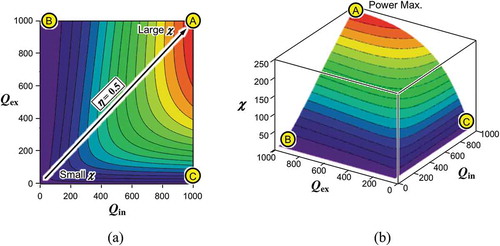
Figure 6. Deliverable power from an equivalent current source (shown in )). (a) Power dissipation in the internal and external resistances. (b) Power allocation ratio. Maximum power is delivered when (impedance matching).
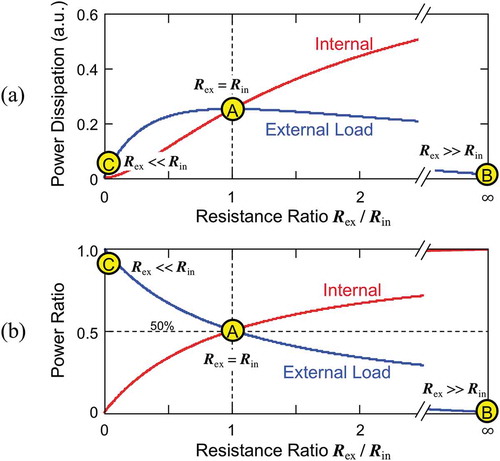
Figure 5. Impedance matching ratio calculated as a function of the internal and external quality factors. (a) Contour plot and (b) 3D plot. Output power becomes 50% of the total source power when
. Note that a high
does not always yield large output power when cross-referenced with
in Figure 4.
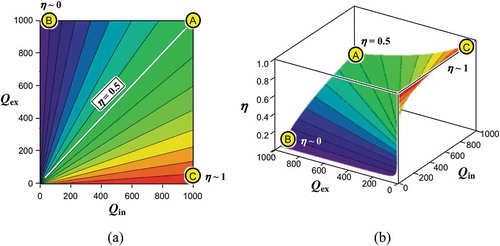
Figure 7. Power leverage factor calculated as a function of the internal and external quality factors when the oscillation amplitude is limited. (a) Contour plot and (b) 3D plot. Conditions for maximum deliverable power are found at point F, where the impedances are not matched.
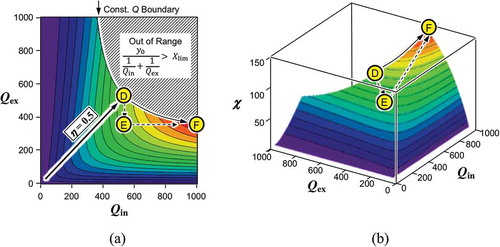
Figure 8. Schematic process to improve the output power when the oscillation amplitude is limited. Enhanced mechano-electric coupling (low ) will temporally lower the output (D to E) but it allows larger acceleration to be received without causing the amplitude clip (E to Eʹ). Equally large output is made possible at a lower acceleration when the internal quality factor is enhanced (Eʹ to F).
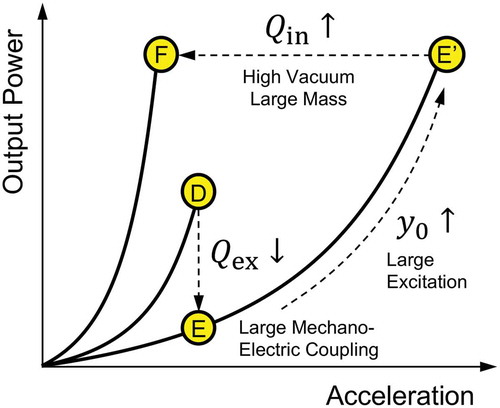
Figure 9. Schematic illustration of mechano-electric conversion principles. (a) Electrostatic induction, (b) electromagnetic induction, and (c) piezoelectric effect.
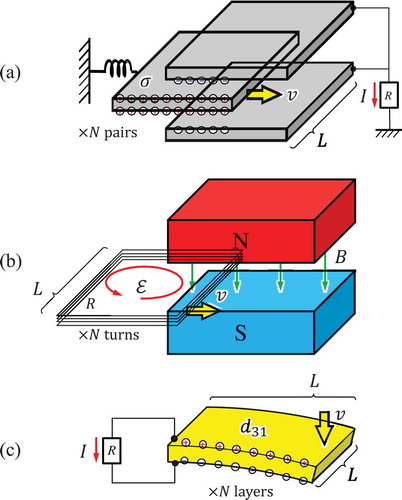
Figure 10. Detailed view of the electrostatic induction type VDRG. (a) The surface of the fixed electrode is coated with a negatively charged silicon oxide. The charges are bound with the positive charge at the silicon oxide/silicon interface at the rest position. (b) When the movable electrode is inserted into the fixed ones, the electrical flux between the negative and positive charges are rearranged in part, and the released electrons flow out, thereby converting the mechanical work into the electrical energy.
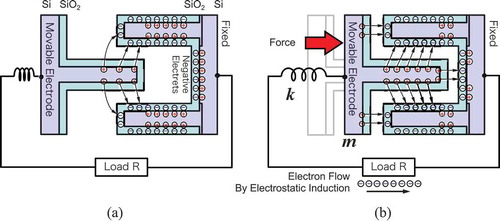
Figure 11. Schematic illustration of electrostatic induction type VDRG. High-density comb electrodes are used to increase the areal mechano-electric coupling. A mass is attached on the movable electrode to increase the mechanical quality factor.
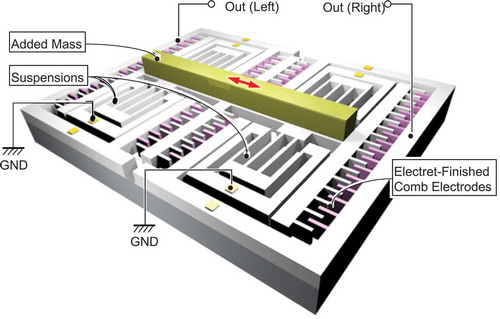
Figure 12. Example of electrostatic induction type VDRG made by the DRIE process on a silicon-on-insulator wafer. (a) Device photograph (30 mm × 20 mm) and (b) a close-up SEM view of the comb electrodes.
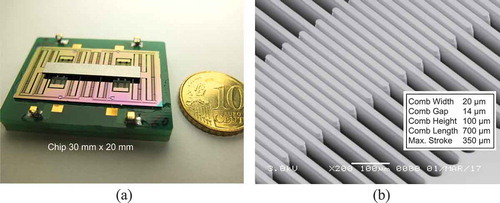
Figure 13. Experimentally measured output power from the electrostatic induction type VDRG (shown in ) as a function of the applied acceleration (1 g = 9.8 m/s2). Mechano-electric coupling is enhanced by using taller comb electrodes.
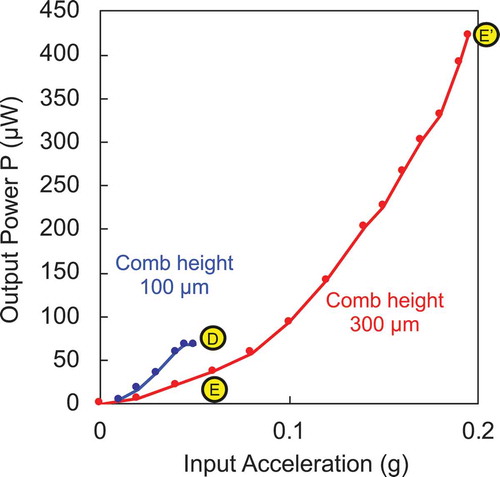
Figure 14. Typical lumped parameter representation of the spring-mass-damper-based electromagnetic vibration energy harvester (left) and equivalent circuit model (right).
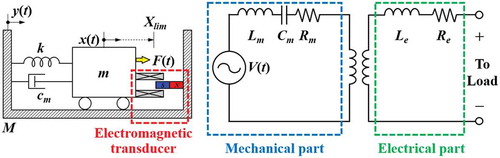
Figure 15. Two different arrangements for the relative displacement between the coil and magnet: (a) magnet moving parallel to the axis of the coil, (b) magnet moving perpendicular to the axis of the coil.
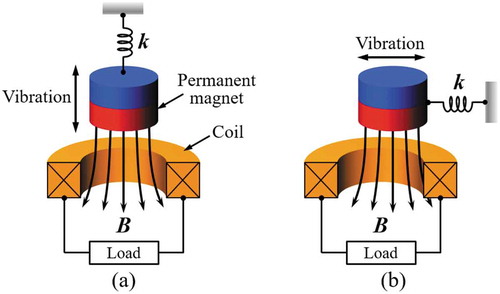
Figure 16. Electromagnetic energy harvesters with different magnet and coil arrangements: (a) magnet moving parallel to the coil axis [Citation26], (b) magnet moving perpendicular to the coil axis [Citation27].
![Figure 16. Electromagnetic energy harvesters with different magnet and coil arrangements: (a) magnet moving parallel to the coil axis [Citation26], (b) magnet moving perpendicular to the coil axis [Citation27].](/cms/asset/4957199b-9c70-4bd4-a4d8-f09514338fe5/tsta_a_1569828_f0016_oc.jpg)
Figure 17. Frequency up-converted electromagnetic energy harvesters (a) using spring-supported inertial mass [Citation30] and (b) using springless proof mass [Citation31].
![Figure 17. Frequency up-converted electromagnetic energy harvesters (a) using spring-supported inertial mass [Citation30] and (b) using springless proof mass [Citation31].](/cms/asset/43167bc6-116d-46fe-8481-6f588ad67512/tsta_a_1569828_f0017_oc.jpg)
Figure 18. Typical lumped parameter representation of the spring-mass-damper-based piezoelectric vibration energy harvester (left) and equivalent circuit model (right).
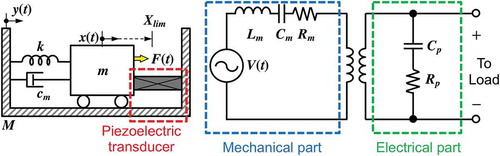
Figure 19. Poling direction of d31 mode (left) and d33 mode (right) piezoelectric materials [Citation34].
![Figure 19. Poling direction of d31 mode (left) and d33 mode (right) piezoelectric materials [Citation34].](/cms/asset/29b99342-948e-4930-8dd2-10c10ad8cdcd/tsta_a_1569828_f0019_oc.jpg)
Figure 20. Schematics of the vacuum packaged piezoelectric energy harvester: (a) using thinned and bonded PZT [Citation44], (b) using an AlN thin film [Citation45].
![Figure 20. Schematics of the vacuum packaged piezoelectric energy harvester: (a) using thinned and bonded PZT [Citation44], (b) using an AlN thin film [Citation45].](/cms/asset/5f6bf9e0-9151-4401-88ee-7b9b1d604c17/tsta_a_1569828_f0020_oc.jpg)
Figure 21. Schematics of the impact-based piezoelectric generator: (a) using the direct impact of a springless proof mass and piezoelectric cantilever [Citation47,Citation48], (b) using indirect impact [Citation49].
![Figure 21. Schematics of the impact-based piezoelectric generator: (a) using the direct impact of a springless proof mass and piezoelectric cantilever [Citation47,Citation48], (b) using indirect impact [Citation49].](/cms/asset/e98a959c-91fb-4bb9-bf46-42178b9e7273/tsta_a_1569828_f0021_oc.jpg)
Figure 22. Benchmark comparison of VDRG performance in a low-frequency range (200 Hz or lower) for the environmental vibrations. (a) Power density comparison and (c) normalized power density comparison [Citation13,Citation50–Citation72].
![Figure 22. Benchmark comparison of VDRG performance in a low-frequency range (200 Hz or lower) for the environmental vibrations. (a) Power density comparison and (c) normalized power density comparison [Citation13,Citation50–Citation72].](/cms/asset/cb2bcfe5-36d9-44e0-b22e-98abf94b10a2/tsta_a_1569828_f0022_oc.jpg)