
Figures & data
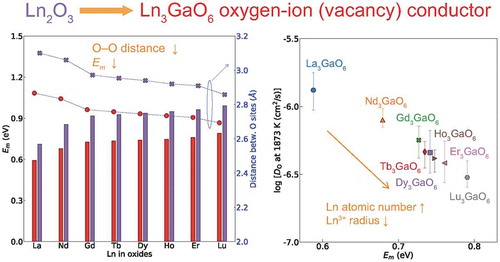
Figure 1. Crystal structure of Ln3GaO6 with space group Cmc21. The supercell (1 × 1 × 2 conventional orthorhombic unit cell) with 24 Ln, 8 Ga, and 48 O atoms is shown. Different types of Ln and O sites are presented by different colors.
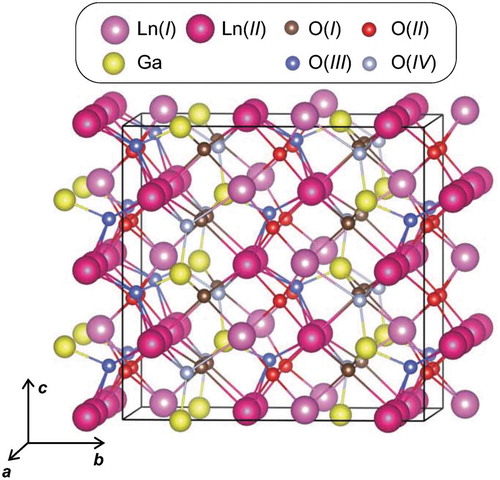
Figure 2. (a) Mean bond lengths of 15 Ln3GaO6 and (b) volume (eV/atom, left vertical axis) of 15 Ln3GaO6 and Ln2O3, and Ln3+ radius (right vertical axis). The experimental values of volume and the radius of Ln3+ are from Refs. [Citation15] and [Citation45], respectively.
![Figure 2. (a) Mean bond lengths of 15 Ln3GaO6 and (b) volume (eV/atom, left vertical axis) of 15 Ln3GaO6 and Ln2O3, and Ln3+ radius (right vertical axis). The experimental values of volume and the radius of Ln3+ are from Refs. [Citation15] and [Citation45], respectively.](/cms/asset/8defb199-6dba-4143-a9a7-7e1d3ccf497f/tsta_a_1578183_f0002_oc.jpg)
Figure 3. Electronic PDOS of 15 Ln3GaO6 obtained by the GGA+U/w.f method. Only Ln 4f (red) and 5d (yellow), Ga 4s (blue), O 2p (black) levels are drawn for simplicity. Energy is shifted by the computational Fermi level. Occupied and unoccupied levels are drawn as solid and dashed lines, respectively. Positive and negative values of PDOS denote the up-spin and down-spin states of electrons, respectively. For easier viewing, the unoccupied La 5d, Ga 4s, and O 2p levels are 2, 30, and 2 times magnified, respectively, whereas the Ln 4f-levels are 0.15 times decreased.
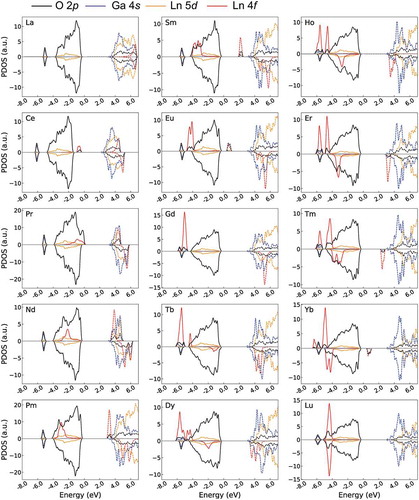
Figure 4. Eg values of 15 Ln3GaO6 obtained by the GGA+U/w.f and GGA/w.o.f methods. The Eg values of eight Ln3GaO6 (Ln = La, Nd, Gd, Tb, Ho, Dy, Er, or Lu) are not significantly different from each other because occupied or unoccupied f-levels are not formed deeply inside Eg(O 2p–Ga 4s).
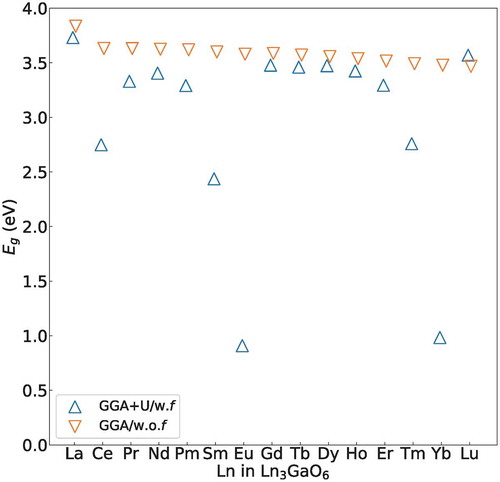
Figure 5. Schematic for the classification of Ln3GaO6 according to the location of occupied (red solid line) and unoccupied (red dashed line) f-level of Ln inside Eg(O 2p–Ga 4s). Black solid and blue dashed curves denote the HOMO (O 2p) and LUMO (Ga 4s), respectively. (a) The first group of Ln3GaO6 has Eg(O 2p–Ga 4s) less affected by the location of f-levels of Ln. (b) The second group of Ln3GaO6 has Eg(Ln 4f–Ga 4s). (c) The third group of Ln3GaO6 has Eg(O 2p–Ln 4f). (d) The last group of Ln3GaO6 has Eg(Ln 4f – Ln 4f), but they are not found.
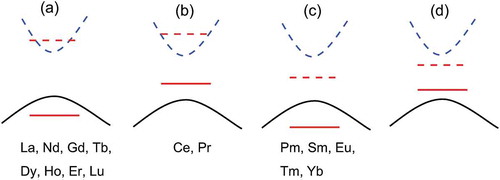
Figure 6. Energy differences (eV/atom) of eight Ln3GaO6 (Ln = La, Nd, Gd, Tb, Ho, Dy, Er, or Lu) with respect to their competing reference states, namely, the coexisting states of ¾(Ln2O3) + ¼(Ga2O3) and ¾(Ln4Ga2O9) + ¼(Ln2O3).
Figure 7. Phonon DOS of eight Ln3GaO6 (Ln = La, Nd, Gd, Tb, Ho, Dy, Er, or Lu). The vertical dashed line denotes zero phonon frequency. No imaginary phonon frequencies are found, which indicates that these eight oxides are dynamically stable.
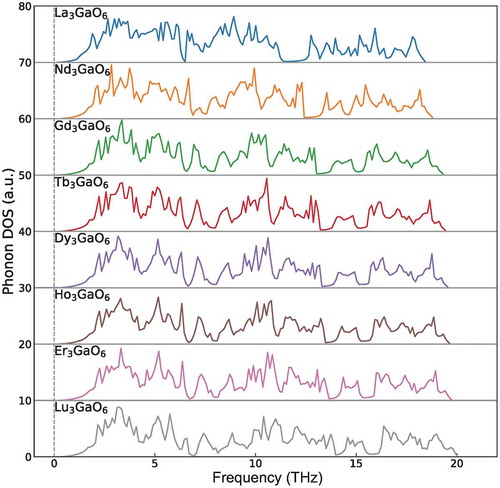
Table 1. Ev of eight Ln3GaO6 (Ln = La, Nd, Gd, Tb, Ho, Dy, Er, or Lu). The computational results in this table are obtained using the GGA/w.o.f method. The Fermi level is located at the HOMO (VBM). The values are in eV.
Figure 8. Ev as a function of Fermi level of La3GaO6. μO is set to be ½E(O2) − 1.75 eV to describe the pressure and temperature at 1 atm and 1500 K, respectively. The other Ln3GaO6 (Ln = Nd, Gd, Tb, Dy, Ho, Er, or Lu) series showed a similar trend (see Supplementary Figures S3). The gradient of the lines denotes the charge of the defect.
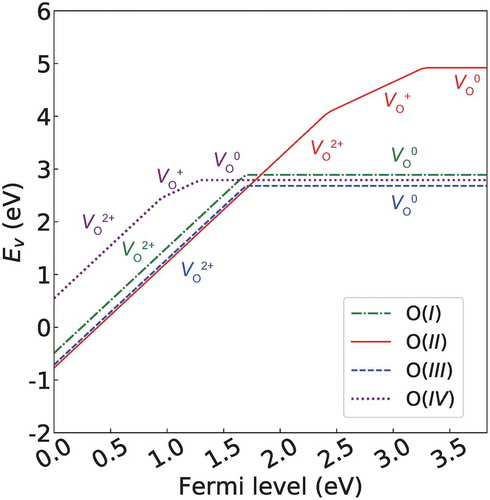
Table 2. Em for various paths of eight La3GaO6. The computational results in this table are obtained using the GGA/w.o.f method. IS, TS, and FS denote the initial, transition, and final states for CI-NEB, respectively.
Figure 9. (a) Em for various migration paths of eight Ln3GaO6 (Ln = La, Nd, Gd, Tb, Ho, Dy, Er, or Lu) and (b) the lowest Em of the eight Ln3GaO6 and their counterpart Ln2O3 (left vertical axis) and the distances between O sites for the migration path in the crystal structure (right vertical axis).
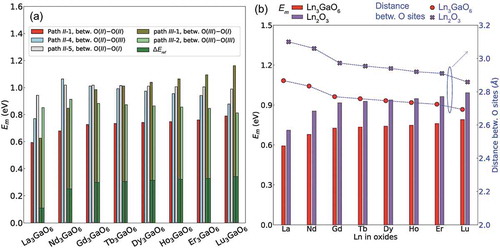
Figure 10. (a) Relationship between DO obtained by FPMD at 1873 K and the lowest Em obtained by CI-NEB, and (b) predicted σO as a function of T based on DO at 1873 K for eight Ln3GaO6 (Ln = La, Nd, Gd, Tb, Ho, Dy, Er, or Lu). Solid symbols denote computed or experimentally measured values from references. Dashed lines denote predicted values. The concentration of VO2+ of our computation is ~2.1% from the computational cell of Ln24Ga8O47. The concentration of VO2+ of Nd2.955Sr0.045GaO5.9775 [Citation13] and Gd2.9Sr0.1GaO5.95 [Citation14] are ~0.4 and ~0.8%, respectively. σO of 10−2 S/cm at 1000 K is described to show a reference level of YSZ [Citation2]. The DO values are averaged from three FPMD trials and error ranges are described between the minimum and maximum values.
![Figure 10. (a) Relationship between DO obtained by FPMD at 1873 K and the lowest Em obtained by CI-NEB, and (b) predicted σO as a function of T based on DO at 1873 K for eight Ln3GaO6 (Ln = La, Nd, Gd, Tb, Ho, Dy, Er, or Lu). Solid symbols denote computed or experimentally measured values from references. Dashed lines denote predicted values. The concentration of VO2+ of our computation is ~2.1% from the computational cell of Ln24Ga8O47. The concentration of VO2+ of Nd2.955Sr0.045GaO5.9775 [Citation13] and Gd2.9Sr0.1GaO5.95 [Citation14] are ~0.4 and ~0.8%, respectively. σO of 10−2 S/cm at 1000 K is described to show a reference level of YSZ [Citation2]. The DO values are averaged from three FPMD trials and error ranges are described between the minimum and maximum values.](/cms/asset/3058ef48-a5aa-4ed4-a6f0-025e4dab9947/tsta_a_1578183_f0010_oc.jpg)