Figures & data

Figure 1. (a) Experimental principle showing the diamond tip indenting in the in-plane direction of graphene layers of a CF imbedded in polymer matrix; (b) schematics showing the three-point bending holder used to apply tensile stress to the CFRP specimen; (c) scanning helium ion microscopy image of the diamond tip after the experiment; (d) compressive modulus map of the same CF region with and without applied external tensile stress; (e) modulus line profiles created along the white arrows in (d) showing large modulus hardening of the stressed CF; (f) height line profiles created at the same positions as (e). Inset showing one height map of the same CF region; (g) indentation moduli obtained from a CF during cyclic tensile loading of four different average stresses with comparison to Raman spectroscopy measurements.
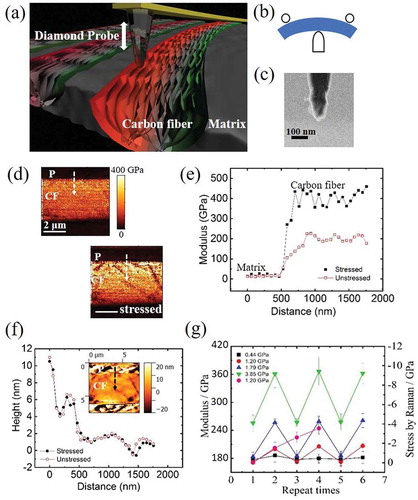
Figure 2. (a) Low magnification TEM image showing the AFM tip indenting on a specimen sliced from a CF. Inset shows high-resolution image about the indented region; (b,c) fast Fourier transform patterns of the same region as marked by the dark square in (a), where misalignment angle of graphene layers changed before and after the application of indenting force of 220 nN; (d) plot of misalignment angle with the applied indenting force to the CF specimen.
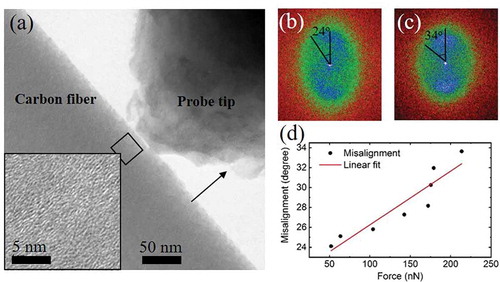
Figure 3. (a) Force–displacement curves obtained from the same position on a CF with and without external stress; (b) finite element method (FEM) model for indentation modulus simulation of carbon fiber; (c) simulation result of compressive moduli against misalignment angle for in-graphene-plane indentation; (d) calculated modulus of CF versus loading force compared with that of experimentally measured values and measured modulus response to loading force for polymer matrix; (e) plot of elastic force against deformation depth; dark line shows elastic force calculated from misalignment angle–force relationship obtained in the TEM experiment; colored lines show elastic forces expected by subtracting each stress forces from total load force; (f) plot of calculated modulus relative change against external tensile stress.
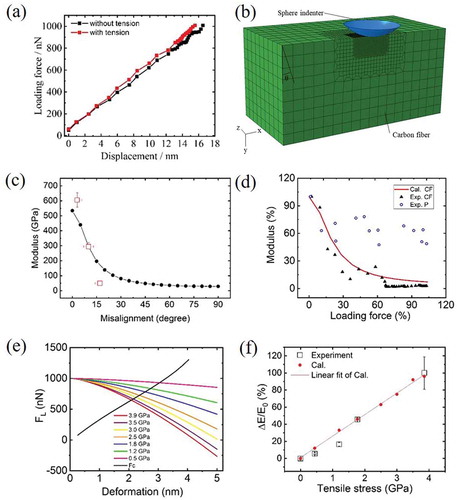
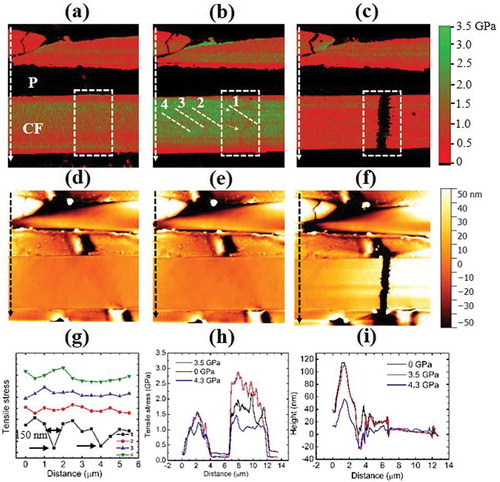
Figure 4. (a) Tensile stress map created in an area on CFRP containing a broken CF at the upper position and an intact CF at the lower position; (b) same region with applied external stress showing stress concentration on the lower intact CF and some newly formed defects; (c) fracture occurred at the lower CF when external tensile stress was further increased; (d–f) height map obtained simultaneously with modulus maps in (a–c); (g) modulus line profiles created at the position marked with 1–4 in (b), showing spatial resolution better than 150 nm at two defect locations; (h) modulus line profiles created along the white arrows in (a–c), respectively; (i) height line profiles created at the same position as in (h).