Figures & data

Figure 1. Overview of creep testing laboratory in Tsukuba.
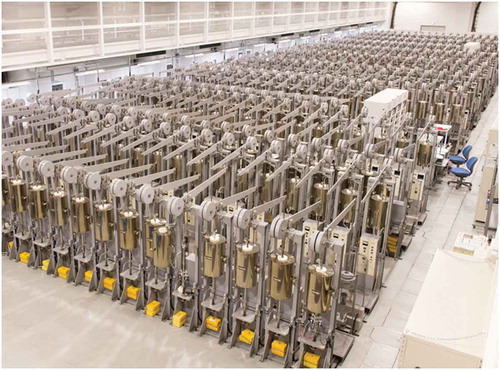
Table 1. List of NIMS creep data sheets.
Table 2. Summary of creep data of all materials examined as of 1 August 2019.
Table 3. Long-time creep rupture data (more than 35 years).
Figure 2. Change of thermoelectromotive force of Type PR thermocouples after creep exposure.
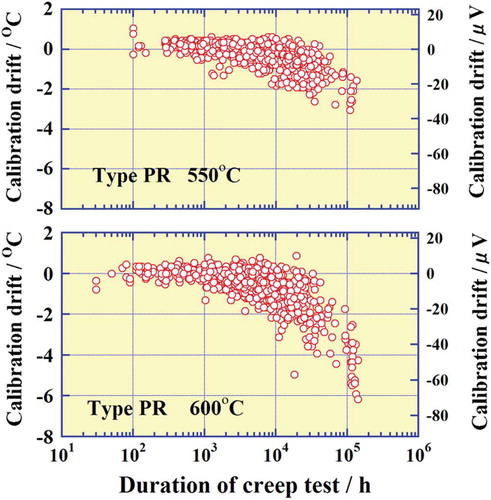
Figure 3. Creep rupture strengths of JIS STBA12, JIS STBA25, and ASTM A542 steels.
Figure 4. Relationship between the reduction of area and Larson–Miller parameter for JIS STBA24, JIS SCMV4NT, and ASTM A542 steels.
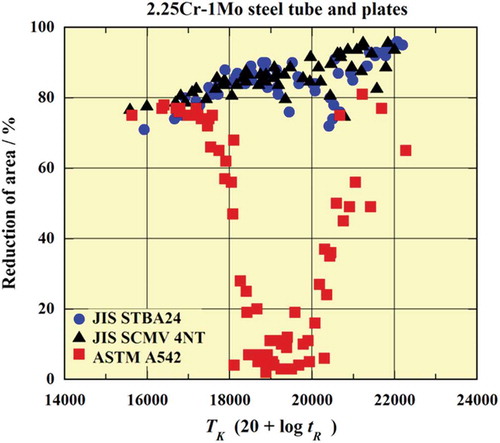
Figure 5. Relationship between stress and Larson–Miller parameter for carbon steels.
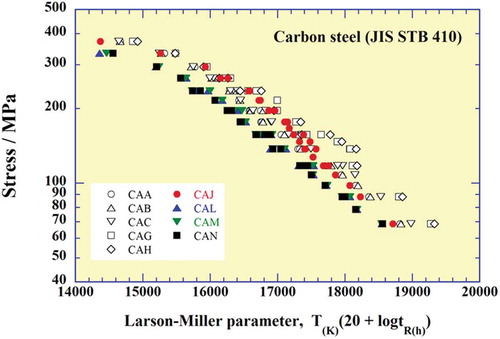
Figure 6. Fitting curves for creep rupture strengths of carbon steels.
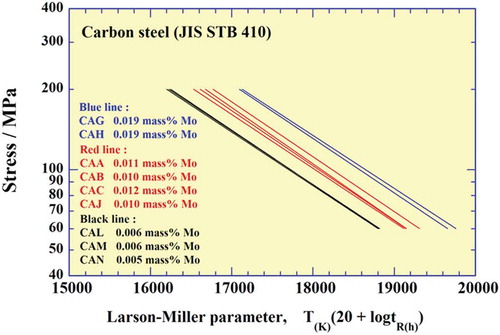
Figure 7. Relationship between estimated time to rupture at 500°C and Mo content for carbon steels.
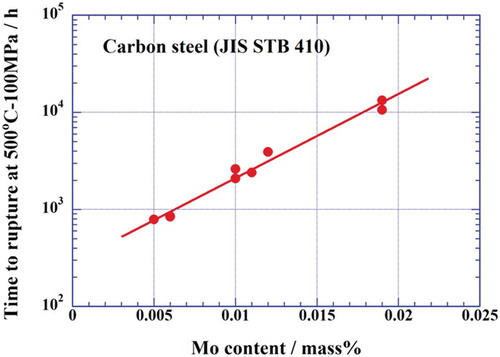
Figure 8. Relationship between stress and time to rupture for 12Cr and 12Cr-1Mo-1W-0.3V steels.
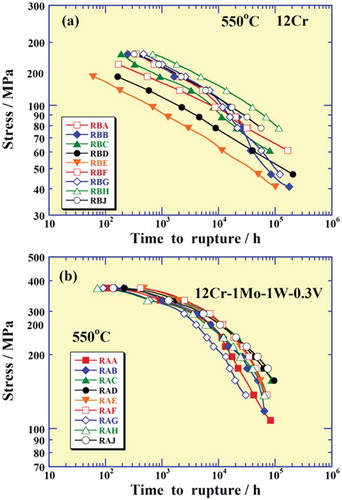
Figure 9. Relationship between time to rupture and effective nitrogen content for 12Cr-1Mo-1W-0.3V steels.
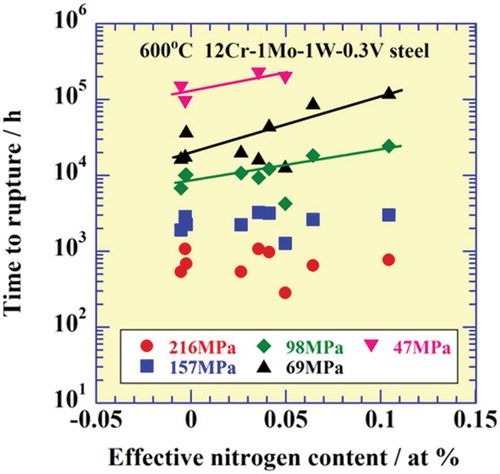
Table 4. Chemical compositions (mass%) of SUS304HTB steel.
Figure 10. Relationship between stress and time to rupture for SUS304HTB, SUS321HTB and SUS347HTB steels.
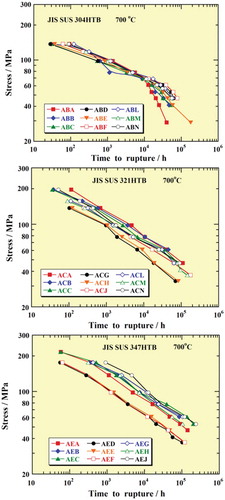
Figure 11. Relationship between time to rupture and effective nitrogen content for SUS304HTB steel.
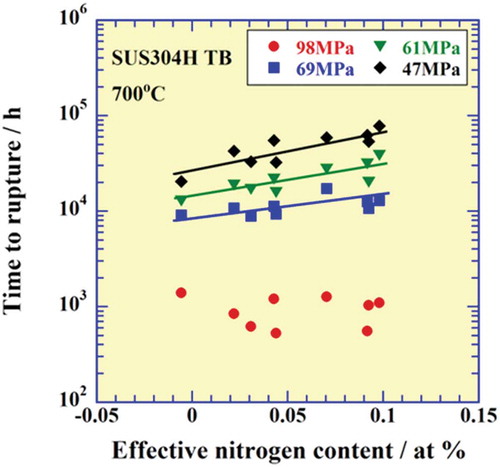
Figure 12. Relationship between time to rupture and grain-size number for SUS321HTB steel.
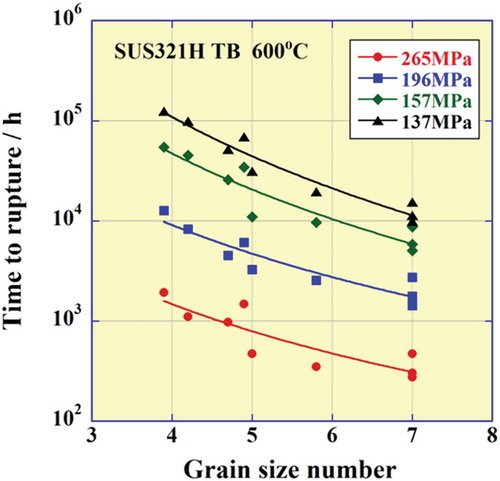
Figure 13. Relationship between time to rupture and boron content for SUS347HTB steel.
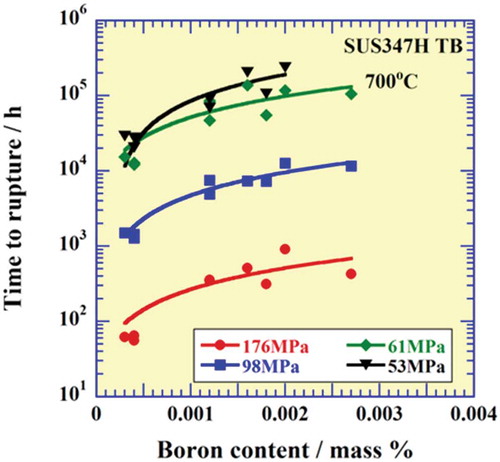
Figure 14. Relationship between stress and Larson–Miller parameter for several ferritic steels.
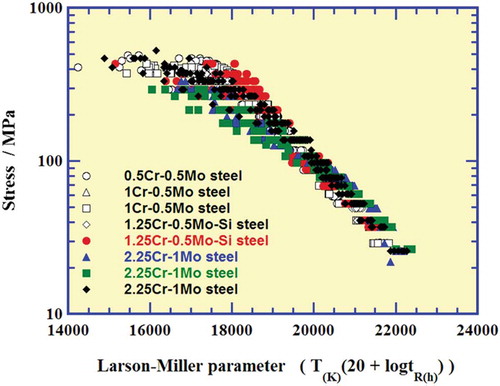
Figure 15. A schematic drawing for inherent creep strength.
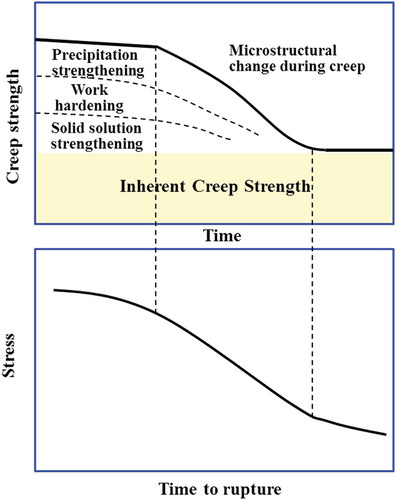
Figure 16. Creep rate versus time curves for 1Cr-0.5Mo steel.
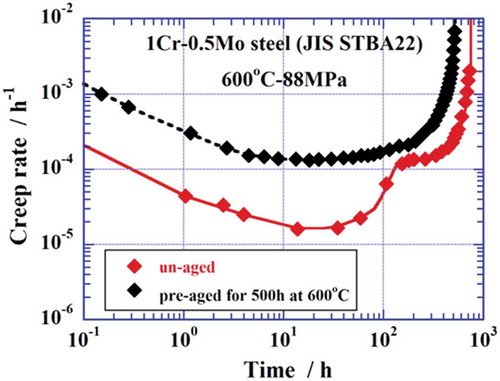
Figure 17. Creep rate versus time curves for Type 316L(N) steel.
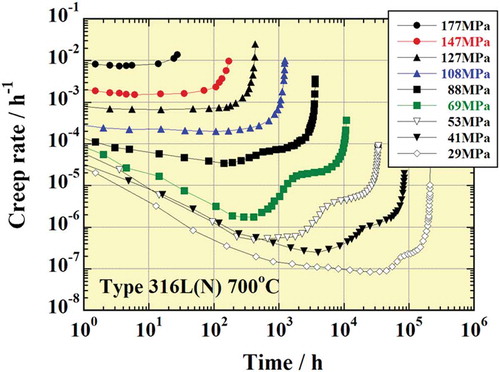
Figure 18. Stress versus time to rupture curve for ASME Gr.91 steel.
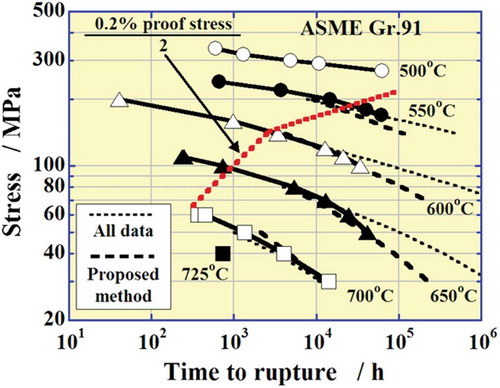
Figure 19. A schematic drawing for microstructural changes during creep for ASME Gr.91 steel.
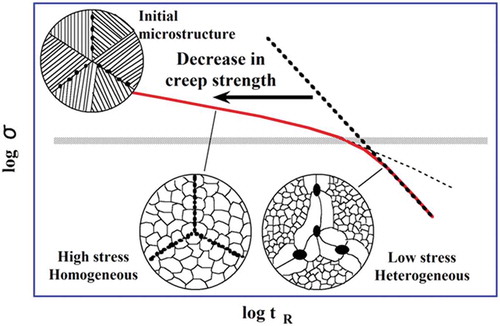
Figure 20. Optical micrographs of gauge portion of creep-ruptured specimens for SUS347HTB steel.
Figure 21. Time–temperature–precipitation diagram for SUS347HTB steel.
Figure 22. Fracture-mode map for SUS347HTB steel.