Figures & data
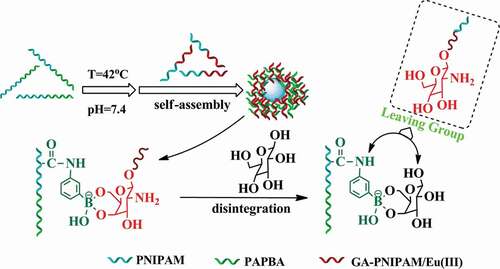
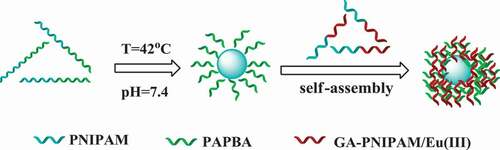
Scheme 1 Schematic of the nanoparticles synthesis
Scheme 2 Synthesis of poly(3-acrylamidophenylboronic acid)-b-poly(N-isopropylacrylamide) (PNIPAM-b-PAPBA) via RAFT
Scheme 3 GA-PNIPAM synthesis by ATRP
Figure 1. 1H NMR spectra of PNIPAM-b-PAPBA
Figure 2. Fourier infrared transmittance spectrum (FT-IR) of PNIPAM-b-PAPBA
Figure 3. Transmittance of PNIPAM-b-PAPBA with different molecular weights at λ = 500 nm and for pH = 7.4 and 9.3
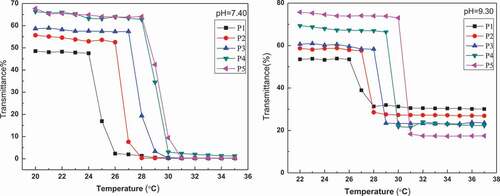
Table 1. LCST behavior of PNIPAM-b-PAPBA with different pH medium
Figure 4. Scattered light intensity recorded for the aqueous mixture (pH = 7.4, T = 42°C)
Figure 5. Intensity-average hydrodynamic radius distributions f(Rh) of complex micelles
Figure 6. TEM images of self-assembly micelles (Scale bar 0.5 μm)
Figure 7. Fluorescence spectra recorded for (GA-PNIPAM)/Eu(III) and complex micelles (excitation wavelength 355 nm)
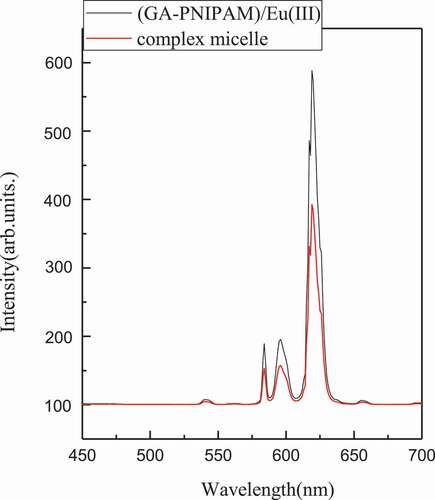
Figure 8. Transmittance for pH = 7.4 solutions of complex micelles
Figure 9. Ph dependence of scattered intensity-average hydrodynamic radius <Rh> recorded for the aqueous mixture of complex micelles
Figure 10. Glucose concentration dependence of scattered light intensity recorded for the aqueous mixture of complex micelles at pH = 7.4
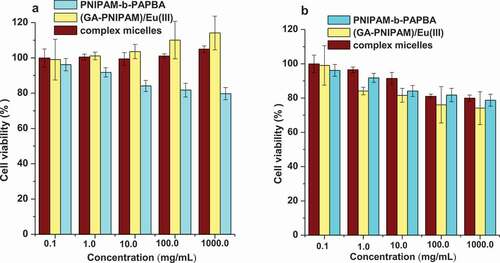
Figure 11. Viability of (a) the L-929 cells and (b) the MCF-7 cells incubated with the samples ((GA-PNIPAM)/Eu(III), (PNIPAM-b-PAPBA) and complex micelles), over a range of sample concentrations from 0.1 to 1000 μg/ml by MTT assay for 48 h