Figures & data
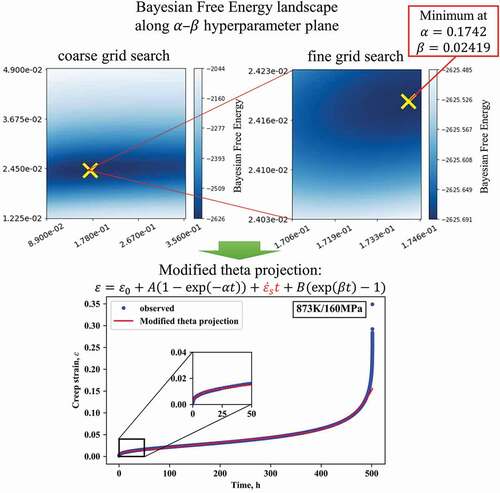
Table 1. Some previous studies of creep curves in which the theta or modified theta method was applied to Gr.91 steel
Figure 1. (a) Schematic diagram of model selection method with grid search. (b) shows how our algorithm worked in the case of applying the theta method to the creep strain curve for 873 K/160 MPa. The four heat maps show the distribution of Bayesian free energy by greyscale, where the point of the lowest free energy in each search area is indicated by the yellow cross mark. The green, red, and purple rectangles inserted in the top three maps show the next search area, respectively. The right-bottom plot shows the transition from the first search area to the final search area
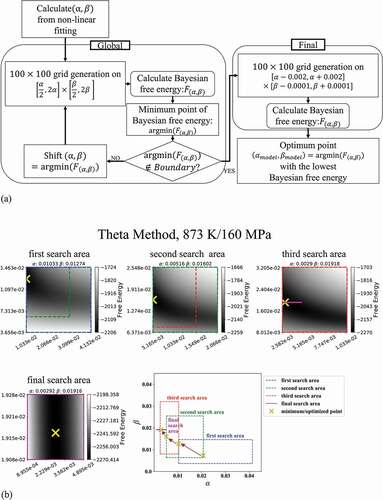
Table 2. Chemical composition of the 9Cr-1Mo-Nb-V (Gr.91) steel
Table 3. Observed rupture time and creep rate, Bayesian free energy, posterior probability of the two models, ratio of fitting parameters for the modified theta method (
) and theta method (
), and the ratio of the steady-state region to the rupture time for the modified theta method in the present ASME Gr.91 steel creep tests. Values for the Bayesian free energy are rounded to integers. Values for the posterior probability, the ratio of fitting parameters
, and the ratio of the steady-state region are rounded to three significant figures
Figure 2. Creep strain curve of Gr.91 steel at 873 K/160 MPa
Figure 3. Fitting of Gr.91 steel creep curve at 823 K/240 MPa with (a) modified theta method and (b) theta method. Log of the creep strain rate against time for 823 K/240 MPa fitted with (c) modified theta method and (d) theta method. The insets in (a) and (b) are enlargements of the primary region. The formulae in (c) and (d) are the derivatives of each term of equations (1) and (2)
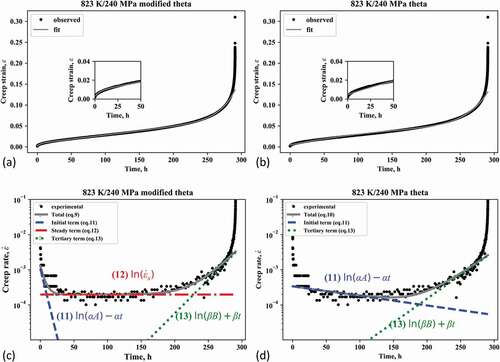
Figure 4. (a) Schematic figure of log of the creep strain rate against time with its fitting by modified theta method. Blue broken, red dot-dashed, and green dotted lines are the asymptotes of the corresponding terms of the equation (similar to FIG. 3.) The gray horizontal line shows the region where the steady-state term (equation (12)) is more than 10 times larger than the other terms (equations (11) and (13)), (b) Steady-state length ratio of Gr.91 steel creep curve estimated by modified theta method. Each length is normalized by the rupture time of the creep test
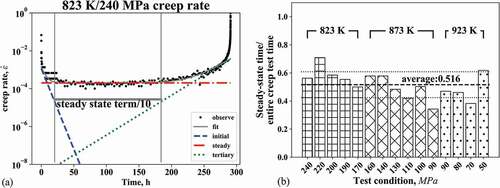
Figure 5. Double logarithmic plot of the creep rate in the steady state, versus applied stress. The standard deviation of the obtained posterior probability of each creep rate is given by the error bars