Figures & data

Figure 1. Experimental setup showing the beam schematic and the modified quenching dilatometer with an entrance/exit window
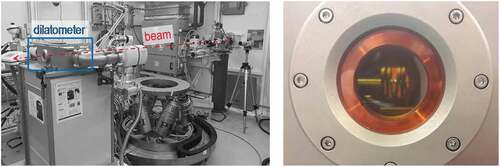
Table 1. Mass fractions of alloying elements in the investigated aluminium wrought alloys
Figure 2. Schematic presentation of the time-temperature-profiles for the experiments
Figure 3. (a) diffraction pattern after cooling EN AW-7150 to room temperature at 0.3 K/s, as recorded by the imaging plate detector, (b) diffraction-data converted into a diffractogram at room temperature after cooling EN AW-7150 at 0.3 K/s
Table 2. Characteristic d-spacing, lattice parameters hkl and calculated 2-Theta angles specific to the applied wave-length ( = 0.012958 nm) with associated intensities for the structures of α-Al (fcc, a = 0.405 nm, η-MgZn2 (hexagonal, a = 0.521 nm, c = 0.860 nm)and S-Al2CuMg (orthorhombic, a = 0.400 nm, b = 0.923 nm, c = 0.714 nm)
Table 3. Characteristic d-spacing, lattice parameters hkl and calculated 2-Theta angles specific to the applied wave-length ( = 0.012958 nm) with associated intensities for the structure of β-Mg2Si (fcc, a = 0.639 nm)
Figure 4. Dynamic evolution of diffraction pattern during the cooling of EN AW-7150 at 0.3 K/s to room temperature after solution annealing at 480°C
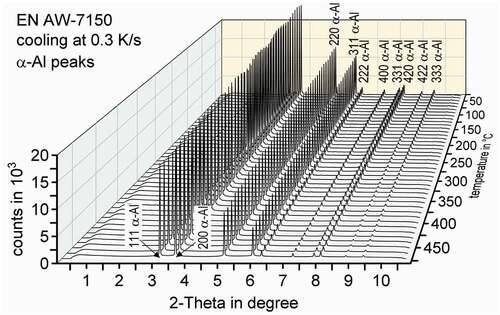
Figure 5. Detailed view of the diffraction pattern during the cooling of EN AW-7150 at 0.3 K/s at different temperatures showing the shift of high-intensity peaks
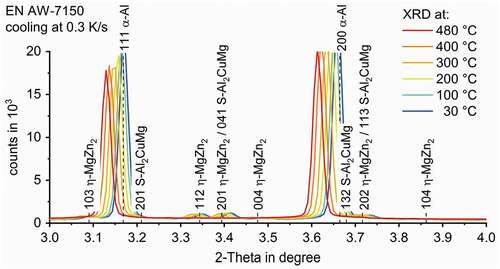
Figure 6. Detailed view of specific diffraction peaks for η-MgZn2 (1.73°), S-Al2CuMg (2.27°) (EN AW-7150 in a) and β-Mg2Si (2.02°) (EN AW-6082 in b) during cooling of a) EN AW-7150 at 0.3 K/s and b) EN°AW-6082 at 0.03 K/s. The background noise, which depends on 2-Theta angle and temperature can be seen
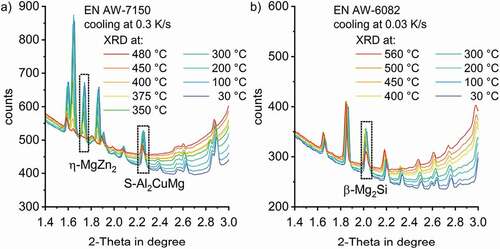
Figure 7. (a) detected diffraction counts for the 002 distance of the η-MgZn2 structure formation in EN AW-7150 during cooling at 0.3 K/s for selected temperatures; (b) normalised signal step specific baselines used for peak area integration
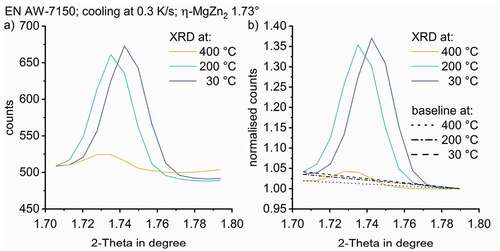
Figure 8. Dynamic evolution of normalised WAXS peaks for EN AW-7150 during cooling at 0.3 K/s after solution treatment for (a) the η-MgZn2 structure (002, 1.73°), (b) the S-Al2CuMg phase structure (111, 2.27°) and (c) the β-Mg2Si structure (111, 2.02°) during cooling of EN AW-6082 at 0.03 K/s
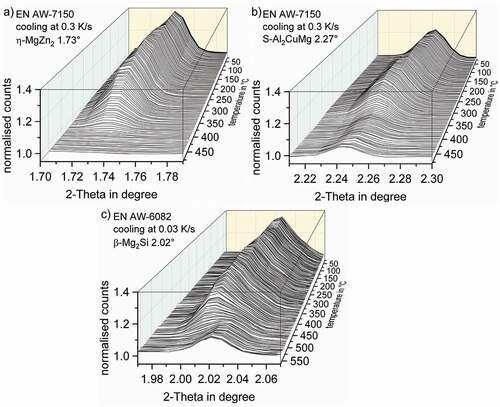
Figure 9. (a), (b), (c) integrated peak areas of η-MgZn2, S-Al2CuMg and β-Mg2Si; (d), (e), (f) differentiation of the smoothed integral curve to the process variable ‘transformation rate’
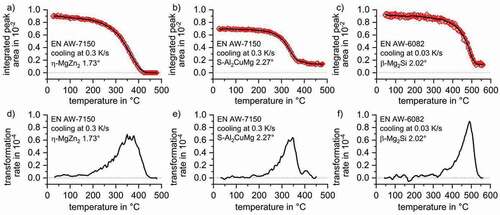
Figure 10. DSC cooling curves of EN AW-7150 after solution treatment indicating a minimum of three precipitation reactions; DSC data adapted from [Citation8]
![Figure 10. DSC cooling curves of EN AW-7150 after solution treatment indicating a minimum of three precipitation reactions; DSC data adapted from [Citation8]](/cms/asset/96ab2521-ebb8-4efc-9349-1503a108011c/tsta_a_1739554_f0010_oc.jpg)
Figure 11. Comparison of obtained WAXS results to DSC curves [Citation8] during cooling of EN AW-7150 after solution treatment
![Figure 11. Comparison of obtained WAXS results to DSC curves [Citation8] during cooling of EN AW-7150 after solution treatment](/cms/asset/cf48f7ad-be28-4d21-962e-1329642c28d2/tsta_a_1739554_f0011_oc.jpg)
Figure 12. DSC cooling curves for EN AW-6082 after solution treatment, indicating a minimum of two precipitation reactions; DSC data adapted from [Citation10]
![Figure 12. DSC cooling curves for EN AW-6082 after solution treatment, indicating a minimum of two precipitation reactions; DSC data adapted from [Citation10]](/cms/asset/e079c07d-f0bc-4272-a449-d242c5ff462d/tsta_a_1739554_f0012_oc.jpg)
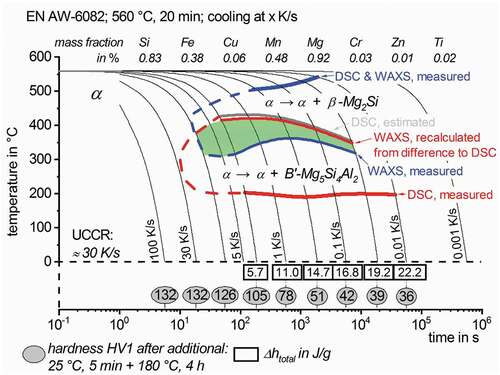
Figure 13. Comparison of WAXS results to DSC curves [Citation10] during the cooling of EN AW-6082 after solution treatment
![Figure 13. Comparison of WAXS results to DSC curves [Citation10] during the cooling of EN AW-6082 after solution treatment](/cms/asset/dd4f08ac-fa86-4981-9185-de6f8604429f/tsta_a_1739554_f0013_oc.jpg)
Figure 14. Improved continuous cooling precipitation diagram of EN AW-6082 after 560°C for 20 min, indicating the temperature ranges of overlapping precipitation reactions