
Figures & data

Table 1. Target aluminum alloys in the 5000, 6000, and 7000 series. Alloy number and temper types are shown.
Figure 1. Flow of our strategy to extract the relations by combining a regression model and MCMC.
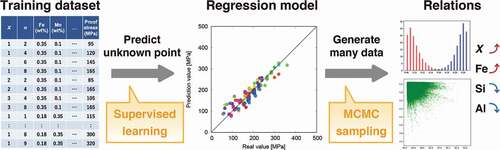
Figure 2. Dependence of the mechanical properties of (a) 0.2% proof stress, (b) tensile strength, and (c) elongation on the temper designations X and n, and the compositions of nine types of elements in the 5000 series. Values of r denote the correlation coefficient. Correlation coefficients in red, blue, and black indicate positive, negative, and no relations, respectively. Each type of aluminum alloy is distinguished by the color of the points.
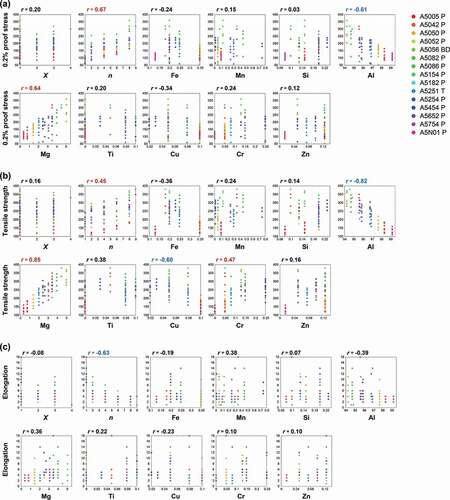
Figure 3. Prediction results by machine learning models for the 0.2% proof stress, tensile strength, and elongation in the 5000 series aluminum alloys. These points are predictions for the test data when the leave-one-out cross validation is performed, that is, for the prediction of each point, target data is not included in the training of the machine learning model. Root mean square error (RMSE) for the test data by the leave-one out method is also denoted. As highlighted in red, the elastic net regression provides a relatively higher prediction accuracy for the three mechanical properties.
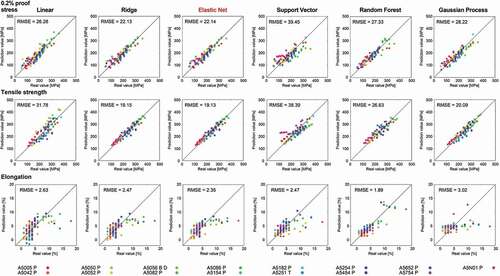
Table 2. Extracted relations between mechanical properties and each explanatory variable for the 5000 series. White and black triangles denote whether to increase or decrease for high (upper table) or low (lower table) mechanical properties, respectively. Bar indicates almost no relation.
Figure 4. Distributions of temper designations X and n and compositions of elements to obtain high (red) or low (blue) mechanical properties by MCMC sampling for the 5000 series aluminum alloys. Elastic net regression is used as a machine learning prediction model. Temper designations X and n have a discrete value, while others have continuous values.
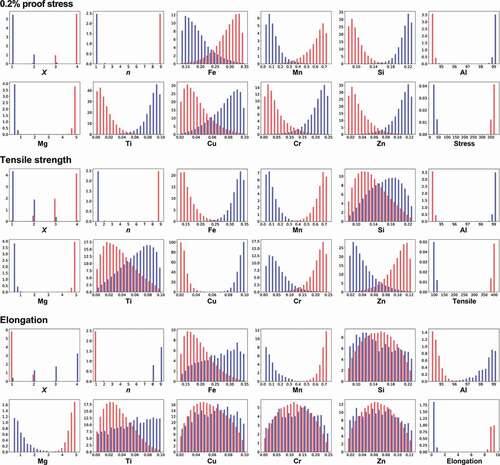
Table 3. Extracted relations between mechanical properties and each explanatory variable for the 6000 series. White and black triangles denote whether to increase and decrease for high (upper table) or low (lower table) mechanical properties, respectively. Bar indicates almost no relation, while asterisk denotes an optimum value exists.
Figure 5. Distributions of temper designation X and compositions of elements to obtain high (red) or low (blue) mechanical properties by MCMC sampling in the 6000 series aluminum alloys. Random forest regression is used as a machine learning prediction model. Temper designation X has a discrete value, while others have continuous values.
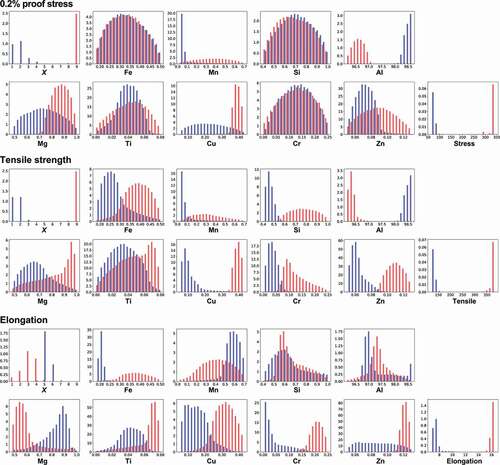
Figure 6. Distributions of temper designation X and compositions of elements to obtain high (red) or low (blue) mechanical properties by MCMC sampling in the 7000 series. Support vector regression is used as a machine learning prediction model. Temper designation X has a discrete value, while others have continuous values.
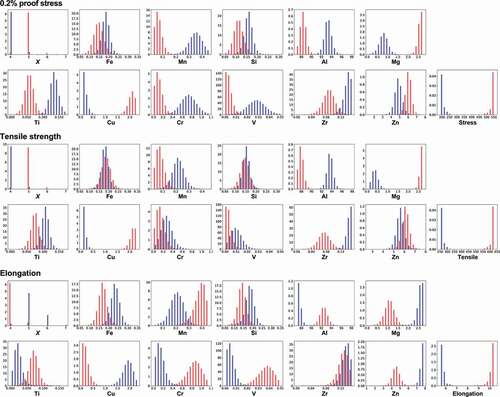
Table 4. Extracted relations between the mechanical properties and each explanatory variable for the 7000 series. White and black triangles denote whether to increase and decrease for high (upper table) or low (lower table) mechanical properties, respectively. Bar indicates almost no relation, while asterisk denotes an optimum value exists.