Figures & data

Figure 1. Concept of this study and molecular generator scheme. NMR-TS tries to identify an unknown molecule from its NMR spectrum (target NMR spectrum) by designing molecules with NMR spectra as similar as possible to the target NMR spectrum. The NMR spectrum of a generated molecule is simulated by quantum chemical calculation. The Wasserstein distance is used to quantify the proximity between the NMR spectra of the target and generated molecules.
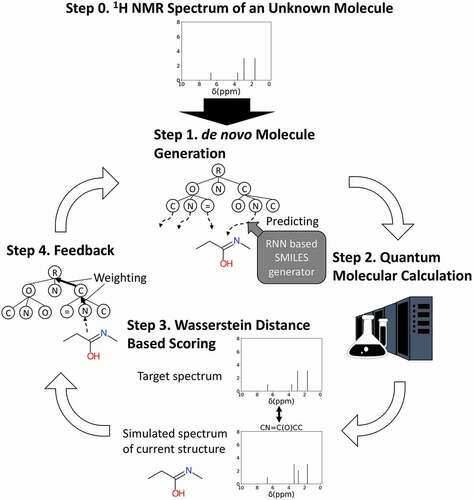
Figure 2. Examples of using the Wasserstein score (WS) to quantify the difference between the target NMR spectrum and the NMR spectra of SMILES generated molecules. A WS closer to 1 indicates high similarity between the spectra. In this example, the spectrum of Cc1cc(C)on1 is most similar to the target spectrum.
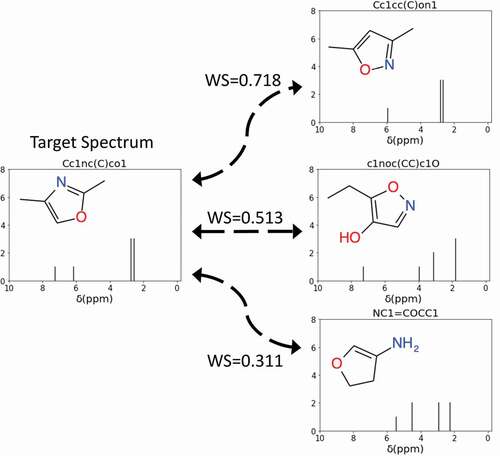
Table 1. Correct answer rate and average Wasserstein score (WS) for each trie size.
Figure 3. Nine test molecules with their chemical structural formulas and SMILES representations.
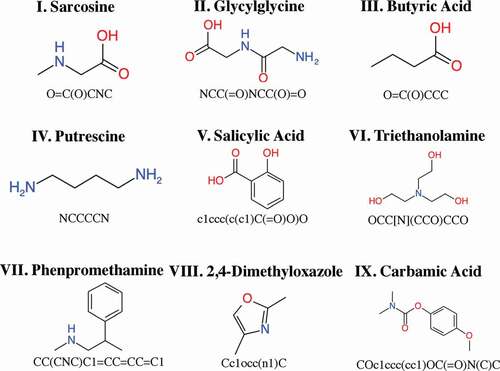
Figure 4. Test molecules, baseline molecules, and best candidate molecules generated by NMR-TS. The corresponding Wasserstein score (WS) is shown for each baseline and candidate molecule. For test molecules I, III–VI, and VIII, NMR-TS gave the correct structures. For test molecules II, VII, and IX, NMR-TS failed to find the correct structures.
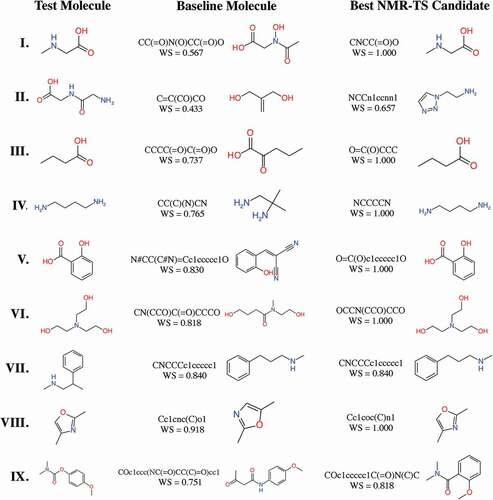
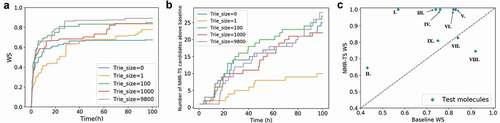
Figure 5. NMR-TS search results for target spectra of test molecules I–IX showing the best Wasserstein score (WS) as the function of time with different trie sizes. See for the details of the different parameter sets.
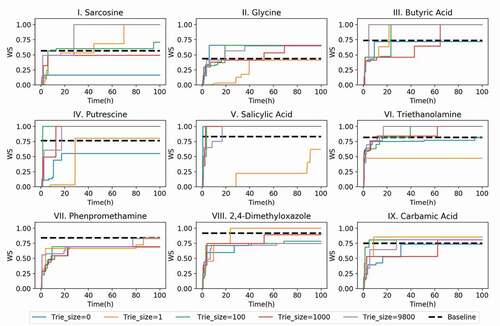
Figure 6. (a) Evolution of the average Wasserstein score (WS) of the best candidates for the nine test molecules over time with different trie sizes. When the trie size is 0, ChemTS starts with a root node without any expansion. When the trie size is 1, 100, 1000, or 9800, a WS is obtained for each spectrum in the database against the target spectrum and based on this ranking, the top 1, 100, 1000, and 9800 molecules, respectively, are fed into the trie. (b) Evolution of the total number of candidates with scores better than the database baseline for all test molecules over time. (c) Comparison of the best candidate scores from the database search and NMR-TS. C = 1, trie size = 9800.