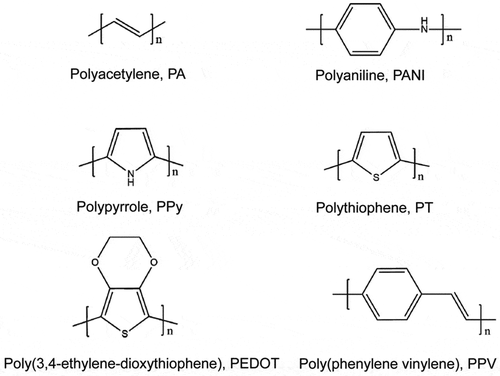
Figures & data
Table 1. Conducting polymer/metal oxides hybrid composites used in gas sensors
Table 2. Conducting polymer/metal nanostructures hybrid composites used in gas sensors
Table 3. Conducting polymer/CNT and polymer/graphene nanostructures hybrid composites used in gas sensors
Table 4. Conducting polymer/multicomponent nanostructures hybrid composites used in gas sensors


![Figure 2. (a) An optical image of PANI/TiO2 nanocomposite-based sensor, (b) SEM images of TiO2 microfibers and (c) PANI/TiO2 nanocomposites. Reprinted with permission from [Citation30]. Copyright 2020 American Chemical Society](/cms/asset/2f4af3a8-4813-4aba-b42e-6c17de0b4155/tsta_a_1820845_f0002_oc.jpg)
![Figure 3. Schematic diagram about synergic effect of CeO2@PANI under NH3 gas. The inset was schematic diagram of P − N junction in equilibrium state. Reprinted with permission from [Citation28]. Copyright 2014 American Chemical Society](/cms/asset/8c8ebbde-9750-40a4-b804-d25da96edc05/tsta_a_1820845_f0003_oc.jpg)
![Figure 4. Schematic diagram of fabrication process of α-MoO3/PANI nanocomposites. Reprinted with permission from [Citation36]. Copyright 2017 Elsevier](/cms/asset/da88ab17-e4b3-43f6-b822-1ab8ca72edf0/tsta_a_1820845_f0004_oc.jpg)
![Figure 5. SEM images of (a) MoO3 nanorods, (b) PANI powder, (c) and (d) MoO3/PANI films with different contents of MoO3 (e.g. 0.1 mg, 0.3 mg, and 1 mg); (e, f) TEM images of the α-MoO3/PANI nanocomposites.Reprinted with permission from [Citation36]. Copyright 2017 Elsevier](/cms/asset/ac166ef2-7e91-4aa9-8ecd-6d4ecd852dfb/tsta_a_1820845_f0005_oc.jpg)
![Figure 6. Schematic diagram of fabrication process of the SnO2@PPy tube-in-tube structure. Reprinted with permission from [Citation37]. Copyright 2013 Royal Society of Chemistry](/cms/asset/467549fc-4121-4880-b9a9-de745f9528cf/tsta_a_1820845_f0006_oc.jpg)
![Figure 7. (a–c) TEM images of the hybrid PPy/Au system and (d) size distribution of Au NPs. Reprinted with permission from [Citation75]. Copyright 2013 Elsevier](/cms/asset/8e4e6131-8b25-46d5-a54f-0f42bd71dc23/tsta_a_1820845_f0007_b.gif)
![Figure 8. Possible gas detection mechanism of PPy/Au hybrids. Reprinted with permission from [Citation75]. Copyright 2013 Elsevier](/cms/asset/d07913d1-c25f-436f-84cb-bd4ae19ec86b/tsta_a_1820845_f0008_oc.jpg)
![Figure 9. (a) Cyclic voltammograms of pristine SWNTs, PANI, and SWNT/PANI nanocomposites; (b) Three oxidation states of PANI. Reprinted with permission from [Citation85]. Copyright 2010 John Wiley and Sons](/cms/asset/ad370f35-c47c-4615-be99-a7ffde5c6669/tsta_a_1820845_f0009_b.gif)
![Figure 10. Schematic diagram of fabrication process of the hierarchically PANI/FMWCNT nanocomposites. Reprinted with permission from [Citation88]. Copyright 2015 John Wiley and Sons](/cms/asset/68dcb763-0a90-4904-a8bd-7b7d8e69dd33/tsta_a_1820845_f0010_oc.jpg)
![Figure 11. (a), (b) Gas-sensing sensitivity of sensors based on PANI/FMWCNT nanocomposite network; (c) selectivity and (d) flexibility of the sensors based on PANI/FMWCNT nanocomposite network. Reprinted with permission from [Citation88]. Copyright 2015 John Wiley and Sons](/cms/asset/986e5b16-2bdc-4dbc-bcb3-9707ac66529f/tsta_a_1820845_f0011_oc.jpg)
![Figure 12. Schematic diagram of fabrication process of the PANI-TiO2-Au ternary nanocomposites. Reprinted with permission from [Citation107]. Copyright 2017 Elsevier](/cms/asset/964a84b4-c76b-4620-8c8f-36e321e6347b/tsta_a_1820845_f0012_oc.jpg)
![Figure 13. Fabrication process of the (CPPy)/CNTs/Pd nanocomposites. Reprinted with permission from [Citation110]. Copyright 2015 Royal Society of Chemistry](/cms/asset/4c5b4116-bb99-4019-b6ef-2114c8407546/tsta_a_1820845_f0013_oc.jpg)