Figures & data

Table 1. The largest Schmid factors for some slip systems in α-Nb5Si3 single crystals with the [021], [010], [001] and [10] orientations
Figure 1. Typical stress-strain curves obtained for micropillar specimens of α-Nb5Si3 single crystals with the loading axis orientations of (a) [021], (b) [010], (c) [001] and (d) [10]. Insets are magnified curves just before failure. A pair of straight gray lines with the elastic slope are indicated as a guide for the eyes in each of the insets. Arrows in the insets indicate the yield points determined as either the elastic limit or the stress for the first strain burst
![Figure 1. Typical stress-strain curves obtained for micropillar specimens of α-Nb5Si3 single crystals with the loading axis orientations of (a) [021], (b) [010], (c) [001] and (d) [1ˉ10]. Insets are magnified curves just before failure. A pair of straight gray lines with the elastic slope are indicated as a guide for the eyes in each of the insets. Arrows in the insets indicate the yield points determined as either the elastic limit or the stress for the first strain burst](/cms/asset/ef98019d-1ce5-4b88-b2a1-4ae7d0bca6aa/tsta_a_1855065_f0001_b.gif)
Figure 2. Deformation microstructures of micropillar specimens of α-Nb5Si3 single crystals with orientations of (a) [021] (L = 3.1 μm), (b) [010] (L = 2.4 μm), (c) [001] (L = 0.75 μm) and (d) [10] (L = 1.4 μm). All images were taken along the oblique direction 30° from the loading axis
![Figure 2. Deformation microstructures of micropillar specimens of α-Nb5Si3 single crystals with orientations of (a) [021] (L = 3.1 μm), (b) [010] (L = 2.4 μm), (c) [001] (L = 0.75 μm) and (d) [1ˉ10] (L = 1.4 μm). All images were taken along the oblique direction 30° from the loading axis](/cms/asset/e6a968cf-b16f-4e4c-8cf7-bf3a8540a8e9/tsta_a_1855065_f0002_b.gif)
Figure 3. (a) A load-displacement curve obtained in a micro-cantilever bend test of a micro-beam specimen having a chevron-notch parallel to (001). (b) An SEM secondary electron image of the fracture surface of the fractured micro-beam specimen
Table 2. Summary of first-principles DFT calculations of generalized stacking fault energy and the critical shear stress τcrit for instantaneous nucleation of new dislocations for (001)<010>, {110}<10> and {0
1}<111> slip in α-Nb5Si3 and Mo5SiB2 [Citation17]. The isotropic elastic constants of G = 127.9 GPa, ν = 0.229 for α-Nb5Si3 [Citation31] and G = 127.9 GPa, ν = 0.229 for Mo5SiB2 [Citation41] were used for the calculations of the τcrit values
Figure 4. The calculated GSFE curves and their derivatives for three slip systems, (a) (001)<100>, (b) {110}<10> and (c) {0
1}<111> in α-Nb5Si3. (d) and (e) indicate the glide planes selected for the GSFE calculations
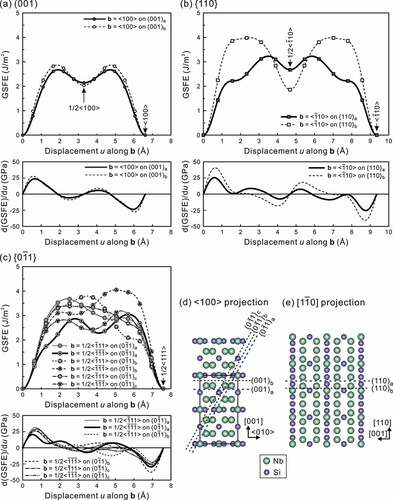
Figure 5. Specimen size (edge length L) dependence of CRSS for (001)<100>, {110}<10> and {0
1}<111> slip. The shaded area (L = 20 − 30 μm) corresponds to the size range, where the CRSS values for micropillar specimens coincide with those obtained for bulk single crystals of many fcc and bcc metals
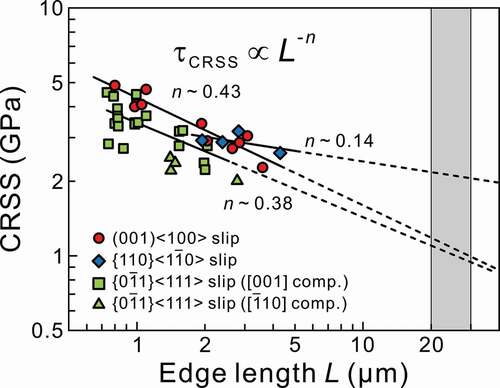
Figure 6. Orientation dependence of the operative slip systems under uniaxial loading calculated with (a) the estimated bulk CRSS values and (b) those for micropillar specimens with L ~ 2 μm for the three slip systems, (001)<100>, {110}<10> and {0
1}<111> in α-Nb5Si3.
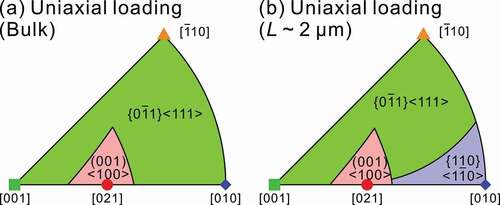
Figure 7. Relationship among the power-law exponent (n), estimated bulk CRSS (τbulk) and theoretical shear strength (τth). (a) n – τbulk, (b) τbulk – τth and (c) n – τth. Error bars for τbulk correspond to the values calculated using the fitted power-law equations for L = 20 μm (upper limit) and 30 μm (lower limit)
Figure A1. Schematic illustration of (a) a chevron-notched micro-beam specimen for single cantilever bend test and (b) the shape of a chevron-notch