Figures & data

Table 1. Lattice parameters obtained from XRD patterns for Ho1-xDyxB2.
Figure 1. Powder XRD patterns and lattice constant evolution for Ho1-xDyxB2 alloys. (a) XRD patterns of the obtained alloys. The red lines show the calculated patterns from Rietveld refinement for the REB2 main phase. The black square (■) marks an REB4 impurity phase, while the black star (★) marks a RE impurity peak and the black diamond (♦) marks a RE2O3 impurity peak (RE = Ho, Dy). (b) The lattice parameters normalized by the value at x = 0, as a function of x. The black dashed line shows a guide based on Vegard’s law, given by where (a,c)0,1 is the lattice constants at x = 0 or 1
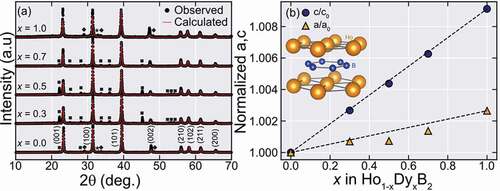
Figure 2. Isofield (M-T) ZFC-FC, Normalized temperature-dependent derivatives of the ZFC curves, and Isothermal (M-H) magnetization curves of Ho1-xDyxB2 alloys. (a-e) ZFC and FC curves for all synthesized alloys for an applied field of µ0H = 0.01 T. The lower panels show the derivatives of the ZFC curves normalized by the minimum of the derivative value. The two magnetic transitions TC and T*, are marked by the arrows. (f-g) Isothermal magnetization at T = 5 K
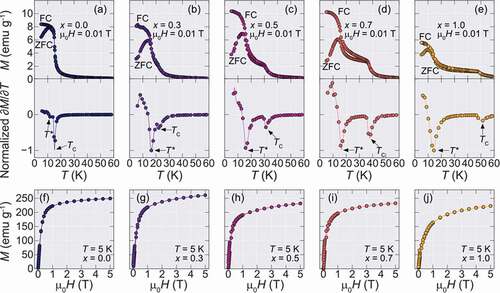
Figure 3. Phase diagram between ordering temperature and doping amount (x) for Ho1-xDyxB2. The blue filled circles show the evolution of TC while the orange triangles show T*. While TC increases monotonically with x, T* remains almost constant
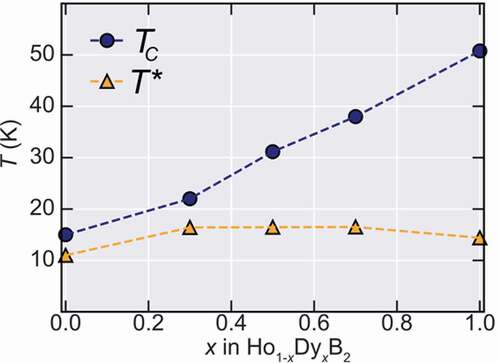
Figure 4. M-T curves at a vast range of applied fields and obtained magnetic entropy change for Ho1-xDyxB2 alloys. (a-e) The obtained M-T curves measured by ZFC process from µ0H = 5 T to 0.01 T. (f-j) Magnetic entropy changes for Ho1-xDyxB2 alloys for µ0ΔH ranging from 1 to 5 T obtained from the M-T curves of (a-e). (k)-(o) Estimated adiabatic temperature change for Ho1-xDyxB2 alloys for µ0ΔH ranging from 1 to 5 T [Citation21]. With the increase of Dy content, the maximum value of |ΔSM| decreases from 0.35 J cm−3 K−1 (x = 0) to 0.16 J cm−3 K−1 (x = 1.0)
![Figure 4. M-T curves at a vast range of applied fields and obtained magnetic entropy change for Ho1-xDyxB2 alloys. (a-e) The obtained M-T curves measured by ZFC process from µ0H = 5 T to 0.01 T. (f-j) Magnetic entropy changes for Ho1-xDyxB2 alloys for µ0ΔH ranging from 1 to 5 T obtained from the M-T curves of (a-e). (k)-(o) Estimated adiabatic temperature change for Ho1-xDyxB2 alloys for µ0ΔH ranging from 1 to 5 T [Citation21]. With the increase of Dy content, the maximum value of |ΔSM| decreases from 0.35 J cm−3 K−1 (x = 0) to 0.16 J cm−3 K−1 (x = 1.0)](/cms/asset/2b515fba-b322-42e8-9803-4da4288f71e1/tsta_a_1856629_f0004_oc.jpg)
Figure 5. |ΔSM| at µ0ΔH = 5 T for Ho1-xDyxB2 alloys
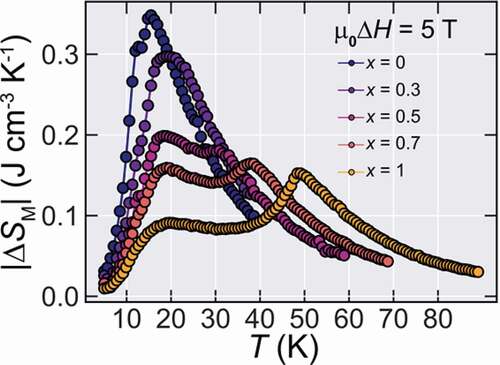
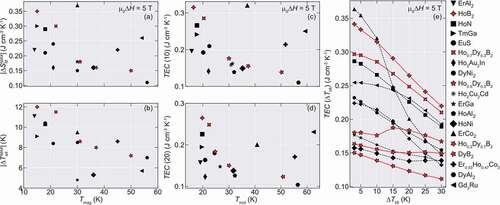
Figure 6. Maximum entropy and adiabatic temperature change and TEC values for Ho1-xDyxB2 alloys and diverse compounds for µ0ΔH = 5 T. (a) |ΔSMMAX| and (b) |ΔTadMAX| as a function of the magnetic ordering temperature Tmag. (c) Values of TEC for ΔTlift = 10 K and (d) for ΔTlift = 20 K. (e) TEC as a function of ΔTlift for few representative materials with high TEC 10 values. The normal and dashed lines guide for the eyes. The TEC values were obtained by using the reported entropy curves within each material reference