Figures & data
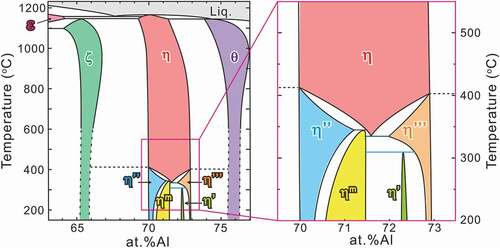
Table 1. Crystal structures of Al-rich intermetallic phases and identified phases in this study
Figure 1. Crystal structure of η phase (space group Cmcm) reported by Burkhardt [Citation12], which consists of a full occupied framework structure with four Fe and eight Al atoms and partially occupied chains with two Al2 and four Al3 sites along the c-axis of the orthorhombic unit cell
![Figure 1. Crystal structure of η phase (space group Cmcm) reported by Burkhardt [Citation12], which consists of a full occupied framework structure with four Fe and eight Al atoms and partially occupied chains with two Al2 and four Al3 sites along the c-axis of the orthorhombic unit cell](/cms/asset/0730d4c0-fdaa-4150-86bc-06d8c4ec2477/tsta_a_1915691_f0001_oc.jpg)
Table 2. Transformation temperatures and reactions from DSC heating curves in
Figure 2. Experimentally determined phase diagram: (a) enlarged low-temperature section and (b) overall view
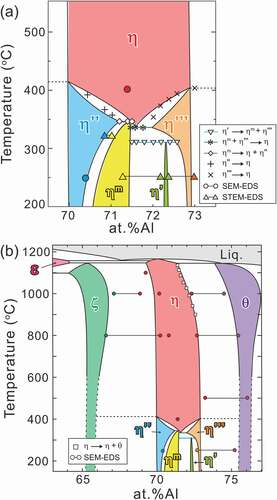
Figure 3. (a) L-DSC and (b and c) H-DSC heating curves for samples equilibrated at 250°C. The vertical scale is shown next to the figure. The temperatures and reactions indicated by various symbols are listed in
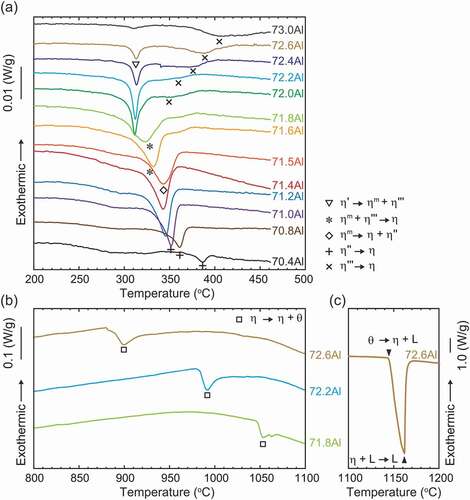
Table 3. Lattice parameters and volumes calculated using Burkhardt’s unit cell [Citation12]
Figure 4. Typical powder XRD patterns obtained from specimens that form a single phase except for the 72.6 at.%Al specimen equilibrated at 250°C. The reference peak positions of the η phase with the reported lattice dimension [Citation12] and site occupancy [Citation17] are appended with black bars. Miller indices indexed with the ordered η’ and η” phases [Citation18,Citation19] are also given in the enlarged graph
![Figure 4. Typical powder XRD patterns obtained from specimens that form a single phase except for the 72.6 at.%Al specimen equilibrated at 250°C. The reference peak positions of the η phase with the reported lattice dimension [Citation12] and site occupancy [Citation17] are appended with black bars. Miller indices indexed with the ordered η’ and η” phases [Citation18,Citation19] are also given in the enlarged graph](/cms/asset/e5cc74ad-ab12-4f22-88be-72ab530f2094/tsta_a_1915691_f0004_oc.jpg)
Figure 5. Composition-dependent changes in lattice parameters and volumes
Figure 6. SAED patterns obtained from the η phase and its higher-ordered η’, η”, η”’, and ηm phases with several beam incidences. Superlattice reflections are highlighted with colored rectangles
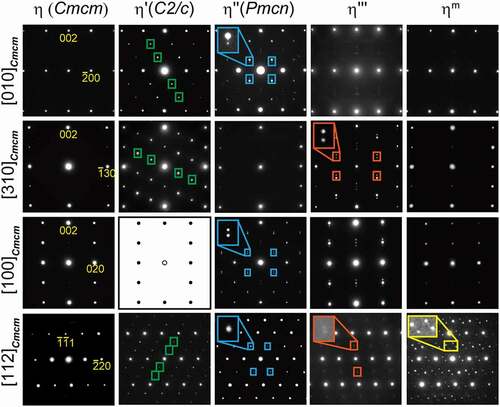
Table 4. Nominal and equilibrium compositions of alloys decomposed into dual phases
Figure 7. Typical dark-field TEM images of two-phase microstructures and corresponding chemical profiles obtained by STEM-EDS for (a) 70.8 at.%Al homogenized at 330°C (b) 71.5 at.%Al homogenized at 250°C, and (c) 72.6 at.%Al homogenized at 250°C. TEM image in (a) was taken using the 31 superlattice reflection with the incidence [11
]Cmcm. TEM image in (b) was taken using the
30 superlattice reflection with the incidence [112]Cmcm. TEM image in (c) was taken using the 11
superlattice reflection with the incidence [111]Cmcm.
![Figure 7. Typical dark-field TEM images of two-phase microstructures and corresponding chemical profiles obtained by STEM-EDS for (a) 70.8 at.%Al homogenized at 330°C (b) 71.5 at.%Al homogenized at 250°C, and (c) 72.6 at.%Al homogenized at 250°C. TEM image in (a) was taken using the 31ˉ1 superlattice reflection with the incidence [112ˉ]Cmcm. TEM image in (b) was taken using the 3ˉ30 superlattice reflection with the incidence [112]Cmcm. TEM image in (c) was taken using the 112ˉ superlattice reflection with the incidence [111]Cmcm.](/cms/asset/7e786897-4bbe-41d6-a9fe-4220aef9fcb7/tsta_a_1915691_f0007_oc.jpg)
Figure 8. Detailed in situ and ex situ powder XRD patterns. Scan speed was 0.2°/h
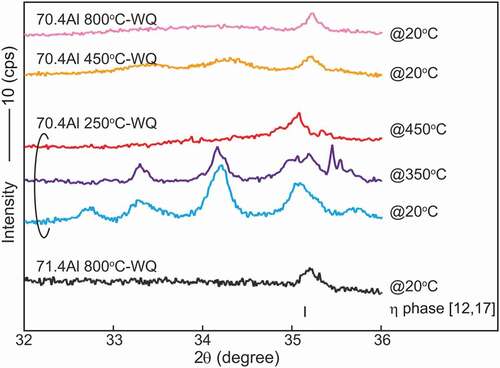
Figure 9. Quenching temperature dependence of L-DSC curve and SAED pattern for a 70.4 at.%Al specimen. To avoid possible error in composition among samples, these data were assembled through one specimen by repeatedly equilibrating at displayed temperatures (followed by water quenching) in order from the lowest to the highest temperatures
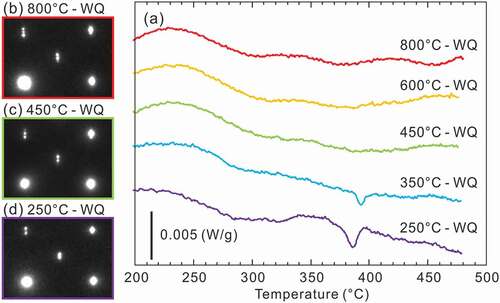
Figure 10. (a) [100]-projected HAADF-STEM images of η” phase obtained from 70.4 at.%Al specimens homogenized at 250°C (upper panels) and 800°C (lower panels). Respective FFT images are also appended. (b) Filtered images of (a) through iFFT process using FFT spots highlighted by yellow circles. (c and d) Corresponding geometrical phase (φ1 and φ2) images presented in the form of cosine, where φ1 and φ2 are assigned as FFT spots highlighted by yellow circles. (e) Density (|▽φ1|and|▽φ2|) maps, where|▽φ1|and|▽φ2|are scaled with blue and red, respectively. (f) Geometrical phase profiles of φ1 and φ2 along green lines given in (c–e)
![Figure 10. (a) [100]-projected HAADF-STEM images of η” phase obtained from 70.4 at.%Al specimens homogenized at 250°C (upper panels) and 800°C (lower panels). Respective FFT images are also appended. (b) Filtered images of (a) through iFFT process using FFT spots highlighted by yellow circles. (c and d) Corresponding geometrical phase (φ1 and φ2) images presented in the form of cosine, where φ1 and φ2 are assigned as FFT spots highlighted by yellow circles. (e) Density (|▽φ1|and|▽φ2|) maps, where|▽φ1|and|▽φ2|are scaled with blue and red, respectively. (f) Geometrical phase profiles of φ1 and φ2 along green lines given in (c–e)](/cms/asset/178afa41-99f2-4e39-842b-b906fe39e599/tsta_a_1915691_f0010_oc.jpg)
Figure 11. Bivariate histograms with variables of |▽φ1| and |▽φ2| obtained from (a) upper and (b) lower panels of Figure 10(e) where Np is the number of pixels
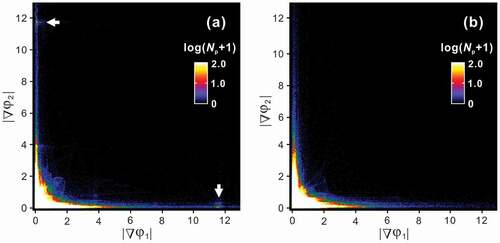
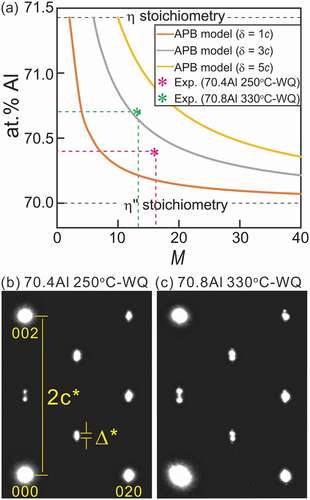
Table 5. Nominal composition of η” phase calculated based on APB models with different width δ for various M values
Figure 12. (a) Nominal composition of η” phase as a function of number of stacking oδrthorhombic η units M calculated based on APB model with different widths of δ = 1 c, 3 c, and 5 c. SAED patterns taken from η” phase in (b) a 70.4 at.%Al specimen homogenized at 250°C and (c) a 70.8 at.%Al specimen homogenized at 330°C