Figures & data
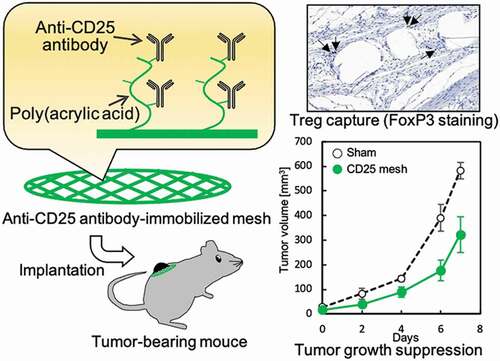
Figure 1. (a) Methylene blue staining. (b) The amount of grafted poly(acrylic acid) on PE mesh (n = 5). *p < 0.01
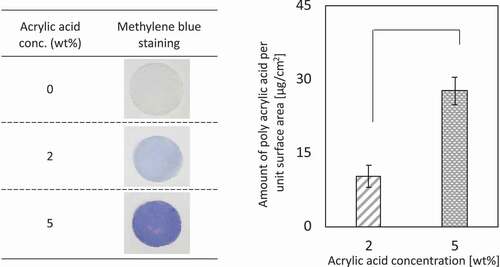
Figure 2. (a) DAB staining of CD25-PE. (b) Amount of the antibody immobilized on the 5 wt% PAAc-PE (n = 5). *p < 0.01
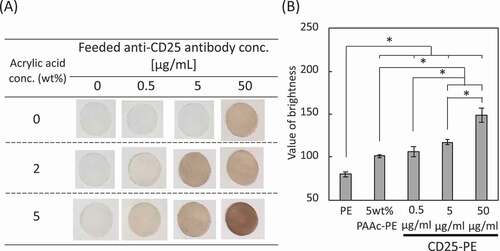
Figure 3. Capturing of mouse spleen cell by CD25-PE meshes (n = 5). *p < 0.05, **p < 0.01
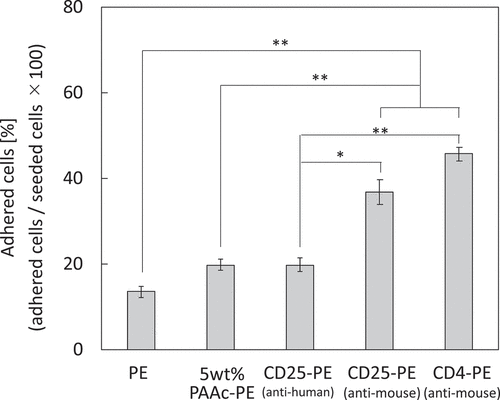
Figure 4. (a) Implantation of PE meshes with and without anti-CD25 antibody subcutaneously into healthy mice. (b) H-E staining of PE meshes with and without anti-CD25 antibody implanted subcutaneously into healthy mice. (c) The number of cells aroud the fibers of the implanted meshes (n = 5). (d) FoxP3 immunostaining of PE meshes with and without anti-CD25 antibody implanted subcutaneously in healthy mice. (e) The ratio of Tregs to cells within 30 µm from mesh fibers (n = 9). *p < 0.05, **p < 0.01. (Scale bar: 100 µm, N.D.: Not detected)
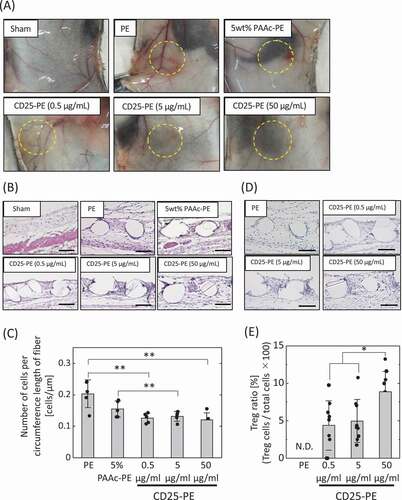
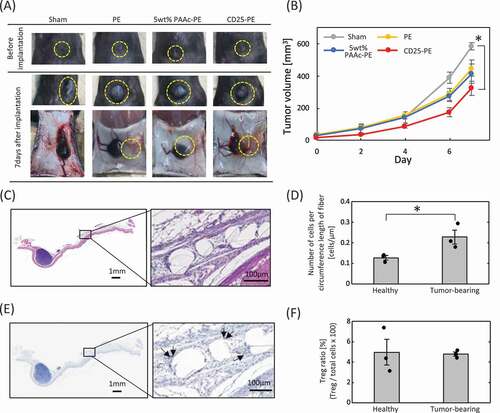
Figure 5. (a) Implantation of PE meshes with and without anti-CD25 antibody into tumor-bearing mice. (b) Tumor growth following implantation of anti-CD25-PE meshes (n = 3). (c) H-E staining of the CD25-PE meshes at 7 days after subcutaneous implantation into tumor-bearing mice. (d) The number of cells around the fiber of the CD25-PE mesh implanted subcutaneously into healthy and tumor-bearing mice (n = 3). (e) FoxP3 immunostaining of the CD25-PE mesh at 7 days after subcutaneous implantation into tumor-bearing mice. (f) The ratio of Tregs to cells within 30 µm from mesh fibers (n = 3). *p < 0.01
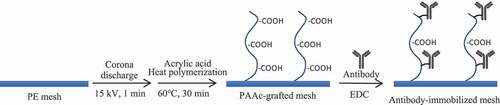
Scheme 1. Preparation of the anti-CD25 antibody-immobilized PE mesh