Figures & data
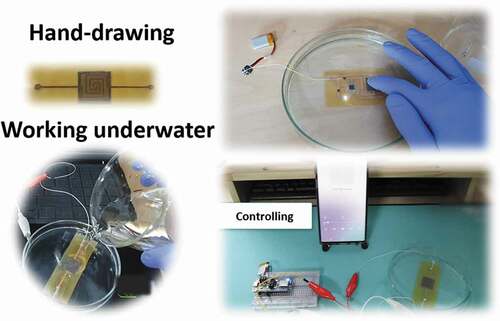
Figure 1. The figure of (a) Sensor fabrication process, (b) Top and bottom side of the sensor, (c) SEM picture of the pyralux film after etching-solution, (d) SEM picture of the sensing layer (wet-tissues) before coated by CNTs, (e) SEM pictures of the sensing layer (wet-tissues) after coated by CNTs
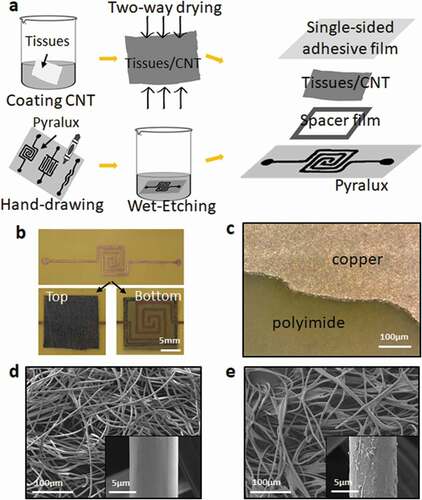
Figure 2. (a) Working principle of the sensor, (b) I–V curves at the different pressures from −5 V to 5 V, (c) Pressure–resistance relationship at the different pressures, (d) Relative resistive change as a function of pressure, showing the sensitivity of the sensor
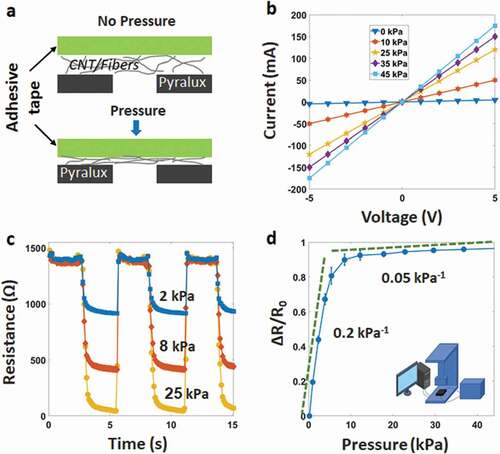
Figure 3. (a) Response-relaxation time, (b) Resistance change at the different frequencies from 0.1 Hz to 5 Hz, (c) Durability of the sensor after 5,000 loading/unloading cycles
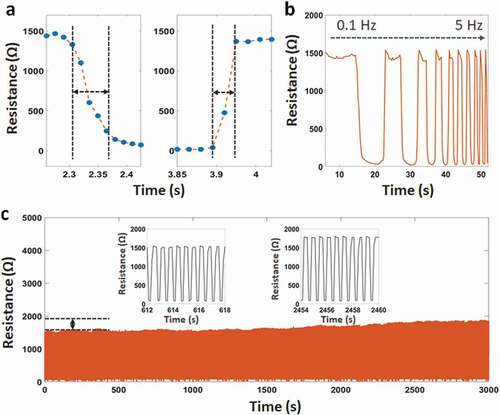
Figure 4. (a) The sensor underwater, (b) Schematic of the testing circuit, (c) Signal change with applied pressure underwater and no-water, (d) Touch signal of the sensor when immersed in the water
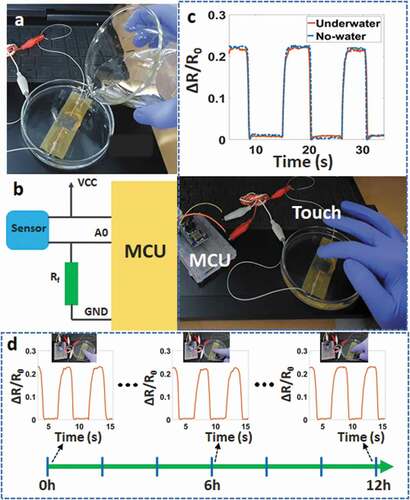
Table 1. Summarizes flexible sensors – based on hand-drawing/papers
Figure 5. (a) Taking a photo on phone when dipping the sensor underwater, (b) Sensor integrated into the mask, (c) Breathing signal
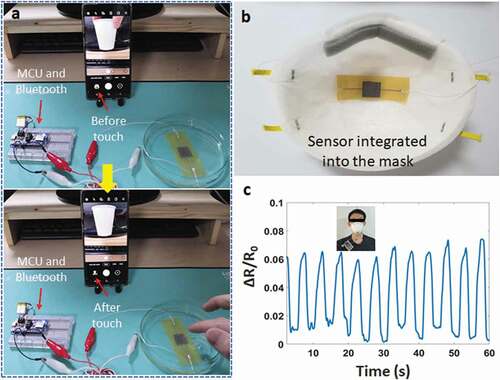
Figure 6. (a) Structure of the matrix sensing layer, (b) Signal change of the matrix layer when applied an object, (c) Schematic of the hand-drawing circuit, (d) Real picture of the hand-drawing circuit, (e) Hand-drawing circuit when working underwater
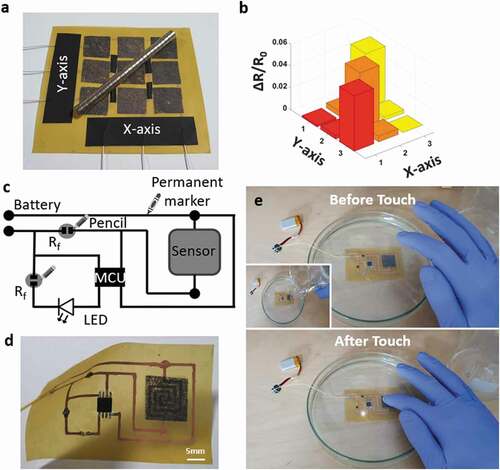
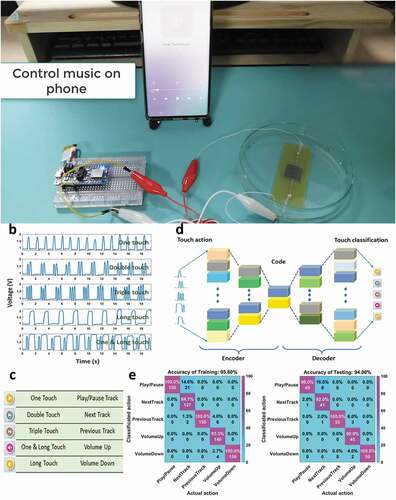
Figure 7. (a) The experimental diagram to control music on phone, (b) Signal of each touch action, (c) Controlling commands corresponding to touch actions, (d) Structure of the autoencoder model, (e) Confusion matrices of the training data and testing data