Figures & data
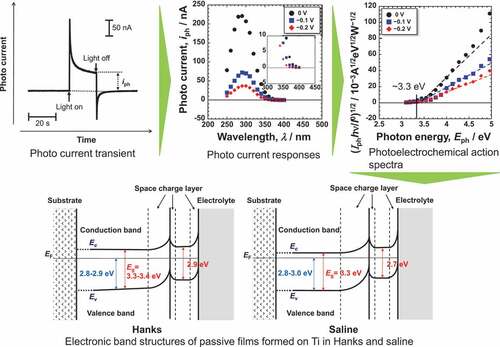
Figure 1. Change in open circuit potentials (OCP) of Ti in Hanks and saline for 72 h.
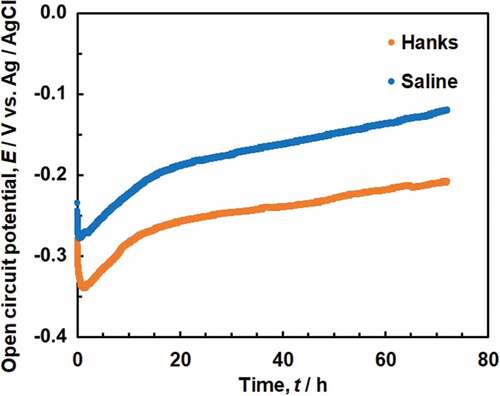
Figure 2. Example of photocurrent transient generated with the light on and off for passive films on Ti.
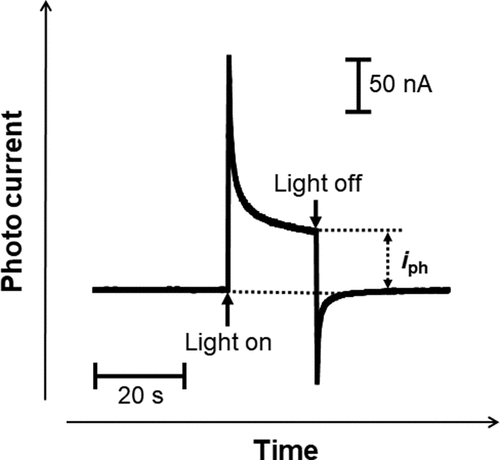
Figure 3. Photocurrent responses of the passive films formed on Ti in Hanks and saline.
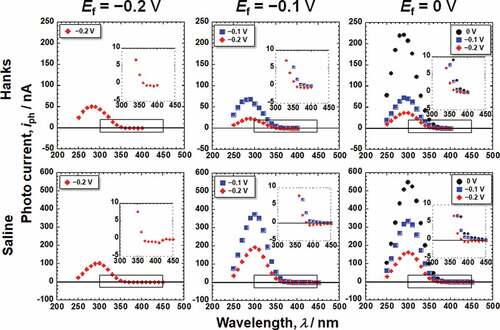
Figure 4. Photoelectrochemical action spectra calculated from the steady photocurrent in Hanks shown in .
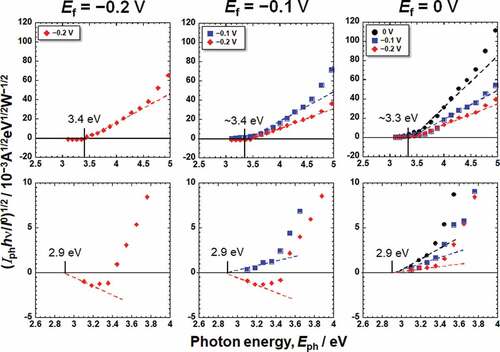
Figure 5. Photoelectrochemical action spectra calculated from the steady photocurrent in saline shown in .
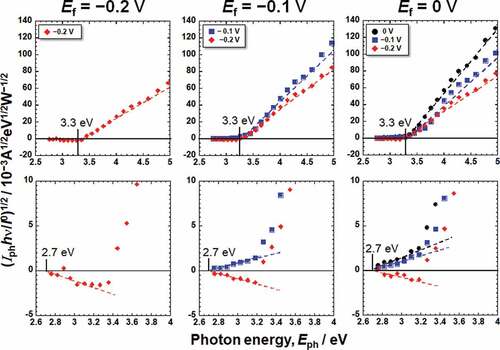
Figure 6. (a) Ti 2p, (b) O 1s, (c) Ca 2p, and (d) P 2p electron energy region spectra obtained from Ti after polarization at 0 V in Hanks for 1 h.
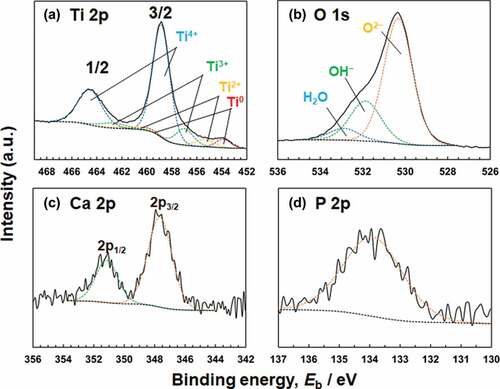
Figure 7. [OH−]/[O2−] ratios calculated form O 1s electron energy region spectra of Ti before and after polarization at each film formation potential, Ef (n = 3).
![Figure 7. [OH−]/[O2−] ratios calculated form O 1s electron energy region spectra of Ti before and after polarization at each film formation potential, Ef (n = 3).](/cms/asset/80622094-3f44-4f31-a02f-21f279e229d3/tsta_a_2066960_f0007_oc.jpg)
Table 1. Relative concentrations of elements, [Ca]/[p] ratios, and thickness of the passive film formed on Ti (n = 3)
Figure 8. Valence band region spectra of Ti after polarization at 0 V in Hanks for 1 h and the determination of the maximum energy of valence band, Ev.
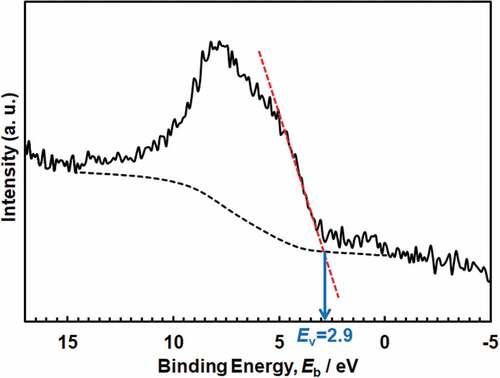
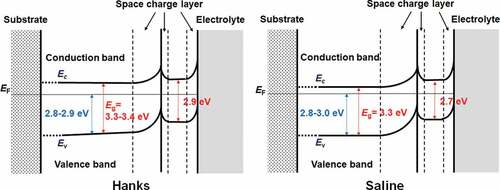
Figure 9. Electronic band structures of passive films formed on Ti in Hanks and saline.