Figures & data
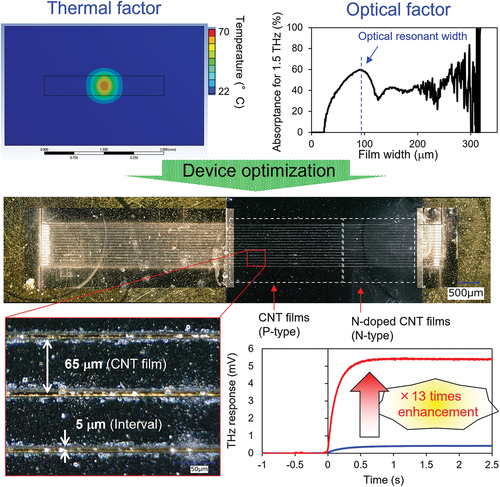
Figure 1. (a) Schematic of the photo-thermo-electric (PTE) sensor. The mechanism of operation is based on the following three steps: 1) conversion of light to heat, 2) diffusion of electrons and holes along a thermal gradient, and 3) generation of voltage; (b) Typical I-V curve of the PTE sensor. Both the thermal and optical factors govern the PTE voltage, as indicated in Equation (1) and (2); (c) Typical transient response of the PTE sensor. The black solid line indicates the experimental THz response and the red dashed line indicates the fitting curve with the transient function of 1 - e−t/τ, whereby τ is the time constant.
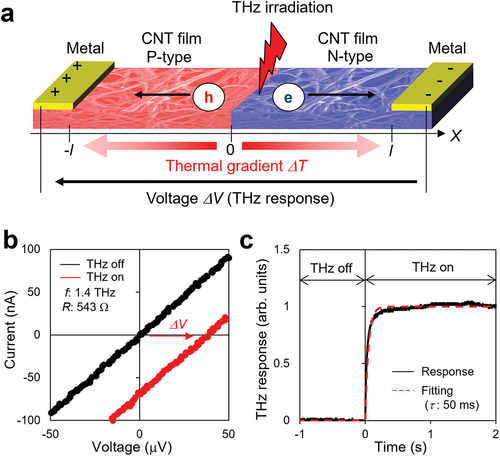
Figure 2. Photographs of the carbon nanotube (CNT) film and schematic of the laser ablation setup.
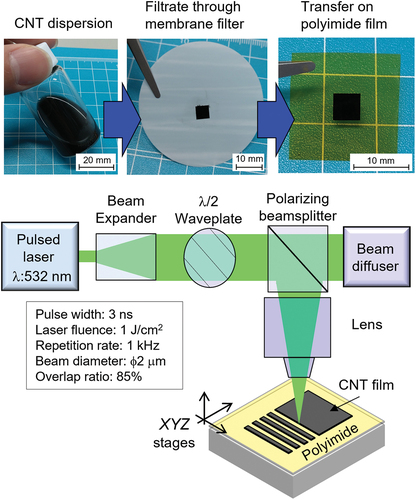
Figure 3. Thermal and optical characteristics of CNT films with respect to the film thickness. (a) Conceptual schematic of the relationship between the thermal/optical factors and film thickness; (b) Thermal characteristics along the film thickness; optical characteristics for (c) 1.4 THz and (d) 361 THz irradiation along the film thickness; (e) Experimental setup of THz response; product of the thermal and optical factors (black dots) and experimental results of THz sensitivity (red triangles) for (f) 1.4 THz and (g) 361 THz irradiation.
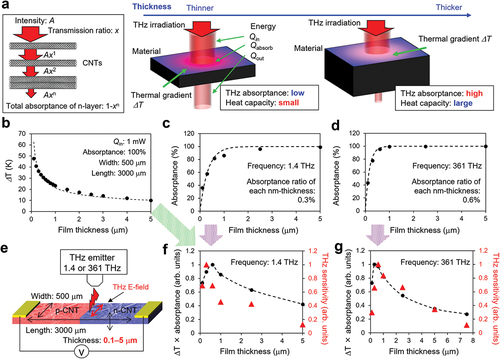
Figure 4. (a) Schematics of antennas and measurement system of the THz time-domain spectroscopy (THz-TDS); transmittance spectrum of the antennas with the antenna size of (b) 350 × 350 µm, (c) 200 × 200 µm, (d) 100 × 100 µm, (e) 80 × 80 µm, (f) 60 × 60 µm, (g) 40 × 40 µm, and (h) 20 × 20 µm. The blue arrows indicate the optical resonant frequency; (i) Resonant frequency versus antenna sizes.
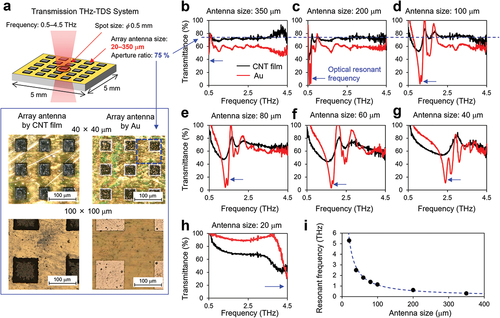
Figure 5. Thermal and optical characteristics of CNT films with respect to film width. (a) Conceptual schematics showing the relationship between the thermal/optical factors and film width; (b) Experimental setup of THz response; (c) Thermal and (d) optical characteristics for 1.5 THz irradiation along the direction of the film width; the product of thermal and optical factors (black line) and experimental results of THz sensitivity (red triangles) for irradiations at (e) 361 THz and (f) 1.5 THz.
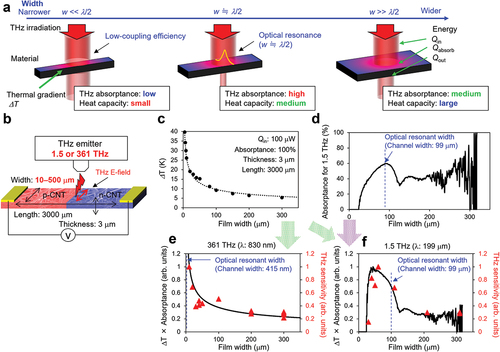
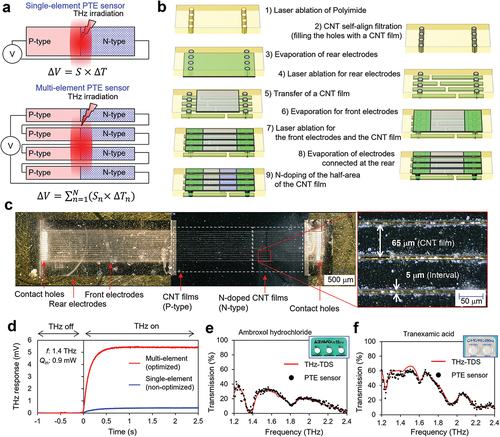
Figure 6. (a) Conceptual schematics of the multi-element PTE sensor; (b) Schematic of the fabrication process; (c) Photographs of the multi-element PTE sensor; (d) THz response comparison between the optimized and non-optimized PTE sensors; THz spectra of (e) ambroxol hydrochloride and (f) tranexamic acid acquired by the multi-element PTE sensor (black dots) and the THz-TDS system (red line).