Figures & data
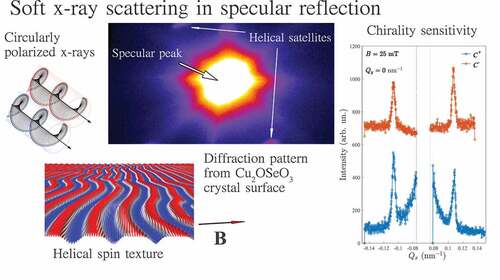
Figure 1. (a) Sketch of the experimental geometry. Circularly polarized soft X-rays impinge onto the samples at an angle and their specular reflection with off-specular magnetic satellites is detected by a position-sensitive 2D detector. The magnetic field
is applied along the in-plane [110] crystal axis. (b) Top view of the ALICE-II chamber (conceptual draw): the beam enters into the main chamber through a flange that can be selected to meet the required acceptance angle of the CCD detector.
![Figure 1. (a) Sketch of the experimental geometry. Circularly polarized soft X-rays impinge onto the samples at an angle θ and their specular reflection with off-specular magnetic satellites is detected by a position-sensitive 2D detector. The magnetic field B is applied along the in-plane [110] crystal axis. (b) Top view of the ALICE-II chamber (conceptual draw): the beam enters into the main chamber through a flange that can be selected to meet the required acceptance angle of the CCD detector.](/cms/asset/bd94260d-ba07-46d0-a797-68ed190db6a6/tsta_a_2131466_f0001_oc.jpg)
Figure 2. (a) AFM image of the polished Cu2OSeO3 crystal, demonstrating the exceptionally high quality of the sample’s surface (0.7nm average roughness). (b) Representative line slice of the topography image. (c) Rocking curve measured around the specular peak.
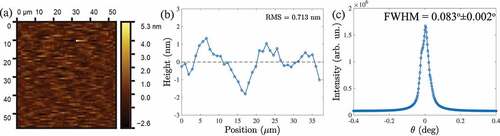
Figure 3. maps of the XRMS intensity measured (a) in the multi-domain helical (
mT), (b) in the single-domain helicoidal (
mT), and (c) in the conical (
mT) states.
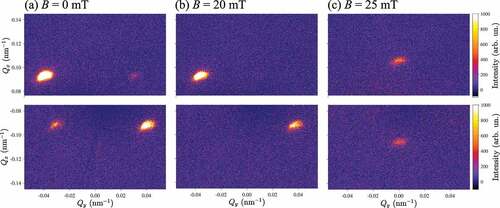
Figure 4. (a) Intensity, (b) position in the k-space (Q) and width (FWHM) of magnetic Bragg peaks vs. magnetic field dependencies in helical (0<B<20 mT) and conical (20<B<40 mT) states.
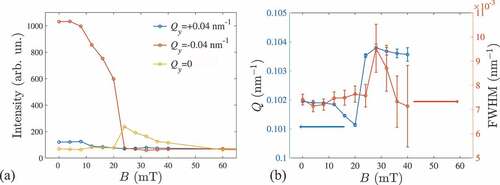
Figure 5. (a) Soft x-ray magnetic scattering (symmetrical scan along , i.e.
-
) in the helical phase, measured for a vanishing external magnetic field and at a temperature of 25 K. The intensity for the circular positive (
) and circular negative (
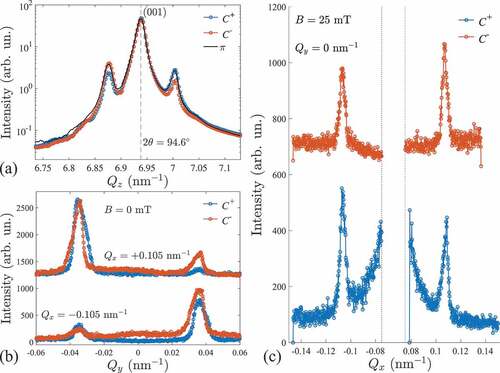
) x-ray helicity shows an asymmetric behavior on the magnetic satellites of (001) Bragg peak at
. For linear (
) x-ray polarization, the intensities of the two side peaks are equal. This demonstrates the sensitivity to the chiral nature of the helical phase at the Bragg condition. (b) Line profiles of the specular-XRMS (non-Bragg) intensity along
measured at
nm
with opposite
and
polarizations at zero field. (c) Polarization-dependent line profiles of the XRMS intensity along
measured at
measured through the conical peaks at
mT.