Figures & data
Figure 1. Scheme of polymer synthesis. Synthesis scheme of α-methoxy-poly(ethylene glycol)-block-poly(glycerol) (PEG-PG) copolymers from ring opening polymerization and amino-acid conjugated PEG-Poly(Glycidyl Glycinate) (PEG-PGGly), PEG-Poly(Glycidyl Leucinate) (PEG-PGLeu) and PEG-Poly(Glycidyl Tyrosinate) (PEG-PGTyr).
Table 1. Characterization of PEG-PGGly, PEG-PGLeu and PEG-PGTyr.
Figure 2. Evaluation of amino acid detachment and cytotoxicity of polymers. Remaining amines in the block copolymers after incubation in pH 7.4 10 mM PBS (a) and pH 5.0 10 mM sodium acetate (b) at 37°C determined by fluorometric assay with fluorescamine. Data are presented as the average ± S.D. (n = 3). (c) Cytotoxicity of polymers against HEK293 cells. The cells were incubated with the polymers for 24 h. Data are presented as the average ± standard deviation (n = 3).
Table 2. Size of micelles determined by DLS.
Figure 3. Stability and release of mRNA-loaded micelles. (a) Diffusion coefficient of fresh micelles after incubation with heparin at different S/P (sulfate in heparin/phosphate in mRNA) ratios for 6 h. (b) After 24-h incubation in HEPES buffer (pH 7.4), the micelles were incubated with heparin at different S/P (sulfate in heparin/phosphate in mRNA) ratios for 1 h, diffusion coefficient was recorded. (c) After 24-h incubation with esterase, micelles were then incubated with heparin at different S/P (sulfate in heparin/phosphate in mRNA) ratios for 1 h, diffusion coefficient was recorded. The upper and lower dashed lines represent the diffusion coefficients of the free mRNA and mRNA loaded micelles, respectively. Data are presented as the mean ± S.D. (n = 10). (d) Remaining mRNA percentage after incubating mRNA-loaded micelles with 50% FBS at 37°C for 15 min, followed by reverse transcription and qRT-PCR quantification. Data are presented as the mean ± S.D. (n = 3). Statistical significance was calculated by one-way ANOVA test. The difference was considered statistically significant with *p < 0.05, ***p < 0.001.
Figure 4. π–π stacking assessment by Tyr fluorescence quenching. Normalized fluorescence intensity of PEG-PGTyr polymer and corresponding fluorescence intensities of the mRNA, polymer and micelles. Data are presented as the mean ± S.D. (n = 3). Statistical significance was conducted using a two-tailed Student’s t-test. The difference was considered statistically significant with *p < 0.05.
Figure 5. In vitro delivery of mRNA-loaded micelles. (a) Representative CLSM images of HuH7 cells incubated with micelles for 8 h (scale bar = 20 μm; Blue: Hoechst; Red: Cy5-labeled mRNA; Green: Lysotracker; yellow: colocalization of mRNA and Lysotracker). (b) Cellular uptake quantified by the mean fluorescence intensity of Red channel from 20 cells in each sample. Data are presented as the mean ± S.D. (n = 20). (c) Colocalization coefficients of Red-Green channels quantified from 10 cells in each sample. Data are presented as the mean ± S.D. (n = 10). (d) Transfection in HuH7 cells after 24 h treatment with micelles encapsulating GLuc mRNA. Data are presented as the mean ± S.D. (n = 4). Statistical significance was conducted using one-way ANOVA and Tukey’s post hoc tests (b) and two-tailed Student’s t-test (c,d). The difference was considered statistically significant with **p < 0.01, ***p < 0.001, denoted with asterisks.
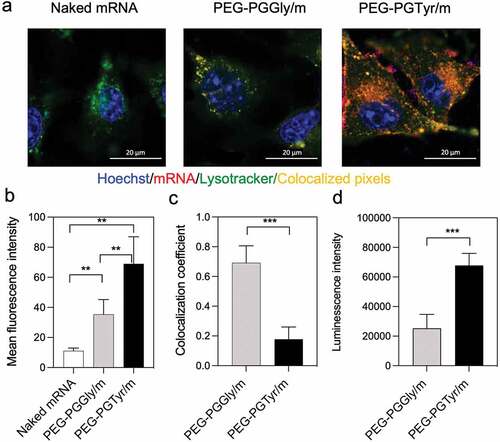
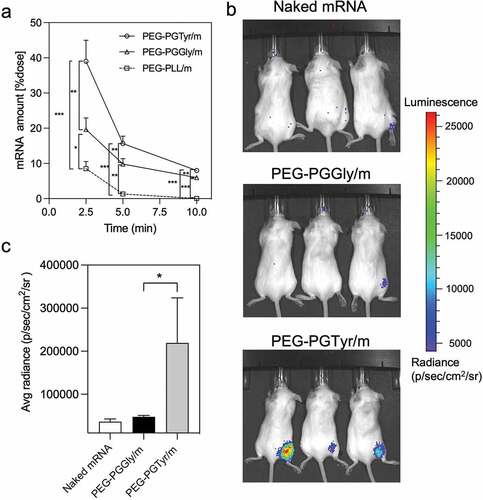
Figure 6. In vivo performance of mRNA-encapsulating micelles. (a) Remaining mRNA amount in the bloodstream of mice after intravenous injection of mRNA-loaded micelles containing 4 μg of mRNA. Data were shown as means ± S.D. (n = 5). Statistical significance was conducted using one-way ANOVA and Tukey’s post hoc tests. (b) Representative in vivo bioluminescence images 9 h after intramuscular injection of Fluc mRNA, PEG-PGGly/m and PEG-PGTyr/m (5 μg mRNA per mouse, n = 3). (c) Quantification of the luminescence signals from the images in b. Data were shown as means ± S.D. (n = 3). Statistical significance was conducted using a two-tailed Student’s t-test. The difference was considered statistically significant with *p < 0.05, **p < 0.01, ***p < 0.001, denoted with asterisks.