Figures & data
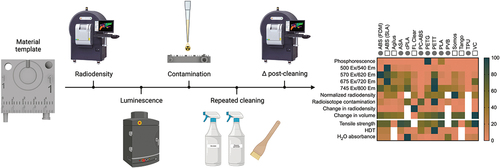
Figure 1. Evaluated materials were printed using from the same template STL file. (a). Front face of template file. High and low relief of numbering in various sizes, rulers, and various connectors are visible. (b). Back face of template file. Grooves for tubing are visible. (c–e). Profile of template print. High reliefs and connectors are visible. (f). Workflow for material evaluations.
Table 1. Full names and abbreviations for the materials evaluated in this study.
Figure 2. Overview of prints and characteristics for selected materials. A1–C5. Front face image of template, 3D printed from A1. Polyethylene terephthalate glycol (PETG). A2. Polylactic acid (PLA). A3. Polycarbonate-acrylonitrile butadiene styrene (PC-ABS). A4. PETT taulman t-glase (PETT). A5. Acrylonitrile butadiene styrene (ABS) printed via FDM. B1. Polyvinyl butyral (PVB). B2. Acrylonitrile styrene acrylate (ASA). B3. Crystalized polylactic acid (cPLA). B4. Thermoplastic polyurethane (TPU). B5. Somos watershed XC 11,122 (somos). C1. Tango. C2. ABS printed via SLA. C3. Clear formlabs resin (FL clear). C4. VeroClear (VC). C5. Vero + agilus 30 (agilus). D-F. Corresponding heat deflection temperatures (HDT, D), tensile strength (F), water absorbance (F) for selected materials.
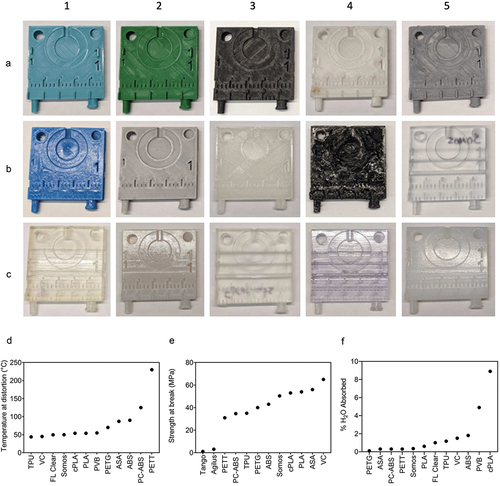
Figure 3. The optical emission profiles of 3D printed materials may interfere in biomedical imaging applications. (a). Phosphorescent and fluorescent signal detected following excitation by wavelengths corresponding to white light (photograph), GFP (500 nm), mCherry (570 nm), Cy5.5 (675 nm), and AlexaFluor 750 (745 nm). (b,c). Quantification of autofluorescence from liver (l), kidney (k), skin (s), and bone (b) samples when imaged alone on lexan (solo; not pictured), adjacent to 3D printed material on lexan (adj; C, bottom right), on top of PETG (C, top left), PLA (C, top right), and PC-ABS (C, bottom left) to illustrate the impact of material fluorescence when imaging biological samples. (d). Naïve mouse imaged between the same samples in C. Fluorescence-only images given in bottom rows of C and D. Emission intensity reported as counts for photographs, average radiance for phosphorescence, and average radiant efficiency for fluorescence.
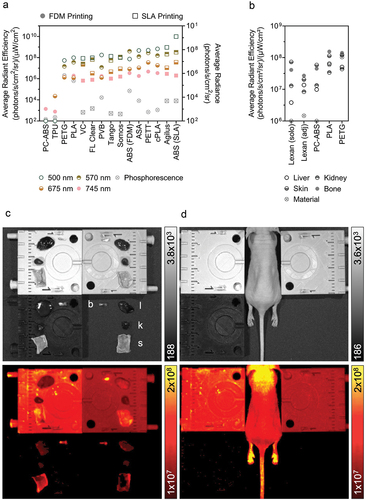
Figure 4. Evaluation of absorption- and degradation-related material risks. (a). Radiodensity of 3D printed templates prior to repeated disinfection by scrubbing, phenolic germicidal, and 70% ethanol (24 cycles). (b). Percentage of residual contamination following exposure to F-18-FDG (droplet placed at +) and subsequent cleaning. (c,d). Change in radiodensity (c) and volume of material (d) following the repeated disinfection protocol described in A. Crosshairs in D indicate location of contamination on all materials. Data given as mean ± SEM. Lowercase letters identify materials with statistically indistinct means.
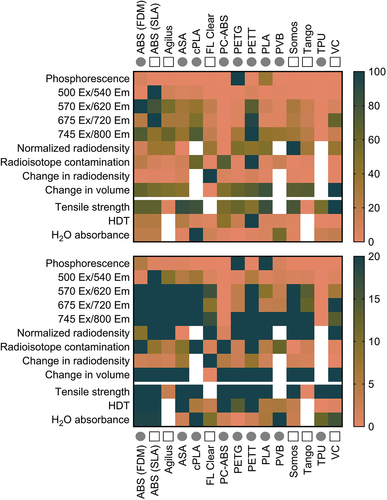
Figure 5. Performance summary for each 3D printed material given in alphabetical order as a percentage of the largest value in each row. The range of values is given in 0–100% (top) and 0–20% (bottom) maximum ranges. Circles denote printing by FDM, squares denote printing by SLA. White cells indicate a lack of data for that metric and material.