Figures & data
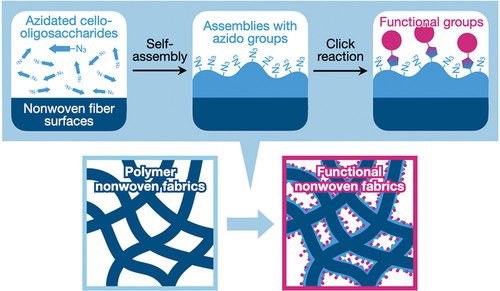
Figure 1. Schematic illustration of this study.
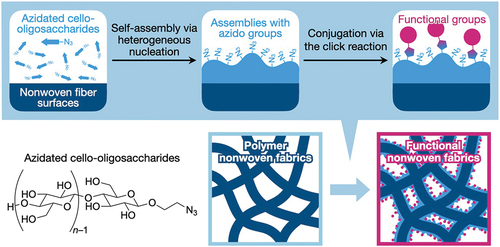
Figure 2. Self-assembly of azidated cello-oligosaccharides in polyolefin nonwoven with IPA. (a) Photographs of polyolefin nonwovens impregnated with different concentrations of IPA aqueous solutions containing 1% (w/v) azidated cello-oligosaccharides. Loading rates of (b) azidated cello-oligosaccharides and (c) cello-oligosaccharides into polyolefin nonwovens at different IPA concentrations. The loading rate values are presented as the average of nine individual trials, and the error bars represent the standard deviation of those trials.
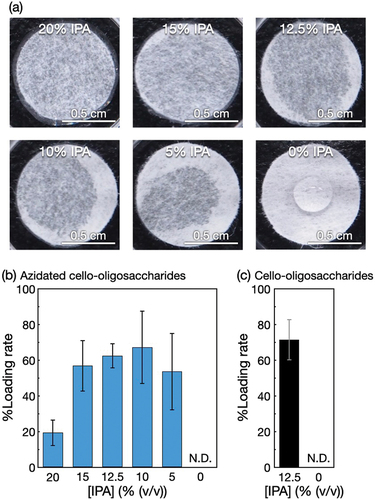
Figure 3. Structural characterization of azidated cello-oligosaccharide-decorated polyolefin nonwovens. (a) Photographs, (b) SEM images, and (c) ATR-FTIR absorption spectra of polyolefin nonwovens with and without azidated cello-oligosaccharides and cello-oligosaccharides.
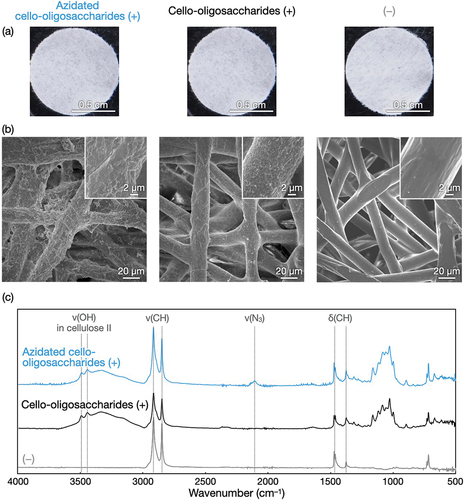
Figure 4. Contact angle measurements for the surface-modified polyolefin nonwovens. (a) Photographs and (b) Contact angles of water droplets on the polyolefin nonwovens with and without azidated cello-oligosaccharides and cello-oligosaccharides. The contact angle values are presented as the average of nine individual trials, and the error bars represent the standard deviation of those trials.
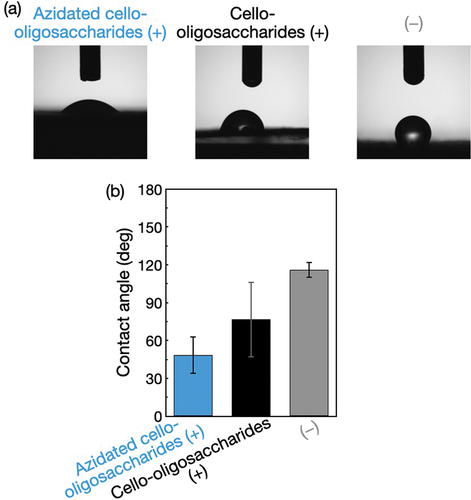
Figure 5. Self-assembly of azidated cello-oligosaccharides at 1% (w/v) in polyester and vinylon nonwovens with IPA. Loading rates of azidated cello-oligosaccharides into (a) polyester and (b) vinylon nonwovens. The loading rate values are presented as the average of nine individual trials, and the error bars represent the standard deviation of those trials. SEM images of (c) polyester and (d) vinylon nonwovens with azidated cello-oligosaccharides. ATR-FTIR absorption spectra of (e) polyester and (f) vinylon nonwovens with and without azidated cello-oligosaccharides.
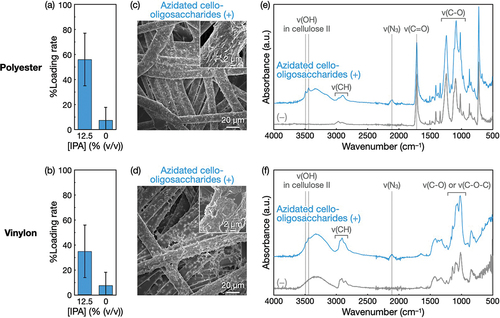
Figure 6. Conjugation of biotin to the polyolefin nonwoven with azidated cello-oligosaccharides via the click reaction. (a) Scheme for the conjugation. (b) MALDI-TOF mass spectra of azidated cello-oligosaccharides in the nonwovens before and after biotinylation.
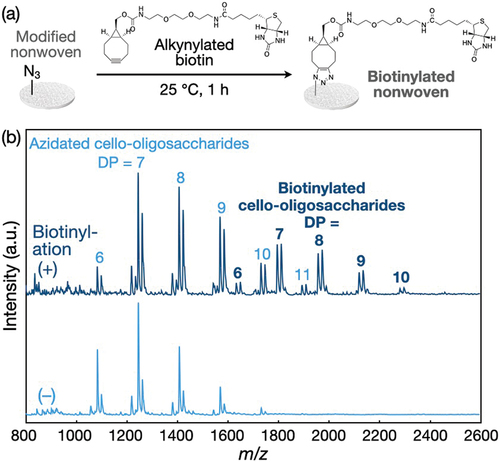
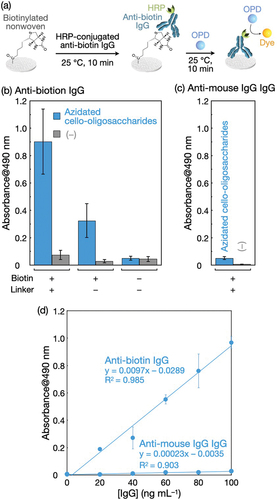
Figure 7. The detection of anti-biotin IgG using the biotinylated polyolefin nonwoven. (a) Scheme for the IgG detection. Absorbance at 490 nm of the HRP-catalyzed reaction products from (b) HRP-conjugated anti-biotin IgG and (c) HRP-conjugated anti-mouse IgG IgG adsorbed on the biotinylated nonwoven and control samples. IgGs were applied at 100 ng mL−1 to nonwovens. The leftmost bars in (b) and (c) (azidated cello-oligosaccharides with biotin (+) and linker (+)) represent the results for the biotinylated nonwovens, and ‘linker’ denotes BCN-amine. The absorbance values are presented as the average of nine individual trials, and the error bars represent the standard deviation of those trials. (d) Effect of IgG concentration on absorbance at 490 nm for detection. The absorbance values are presented as the average of three individual trials, and the error bars represent the standard deviation of those trials.