Figures & data

Figure 1. Schematic outlining procedure for evaluating targeting ligands using high throughput internalization assay. Created with BioRender.com.
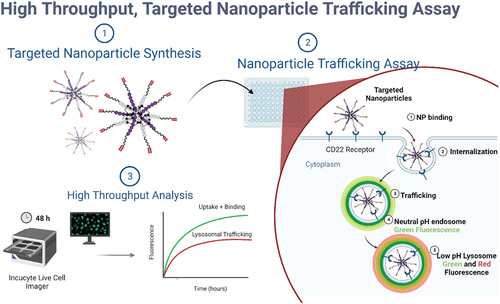
Figure 2. NP synthesis and characterization. (a) Synthesis scheme for tNP created with BioRender.com. (b) Size and polydispersity of non-functionalized NPs (IT0) and 50% azide functionalized NPs (IT50) by dynamic light scattering (DLS). PDI = polydispersity index, P1M = peak one mean size (c) tNP fluorescence in green (AF488) and red (pHrodo red) channels under varying physiological pH conditions. (d) Fluorescence intensity of IT0 and IT50 NPs in AF488 channel at pH 7. (e) Red fluorescence intensity of IT0 and IT50 NPs in pHrodo red channel at pH 4.5 and pH 7. Data is represented as the average ± SEM of N = 3 nanoparticle preparations.
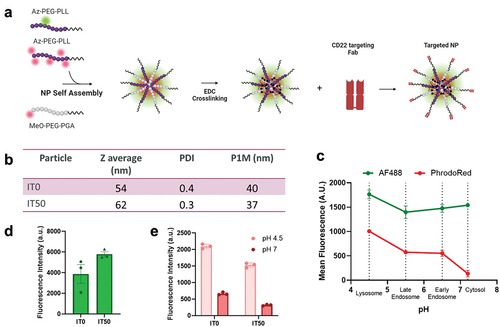
Figure 3. Targeting ligand preparation and conjugation (a) structures of nnAAs with reactive cyclopentadiene or azide chemistries appended to lysine side chains (b) modification of CpHK- and lysine azide-tagged targeting ligands with DBCO-PEG linker (c) Representative LC-MS of Pina Fab before and after functionalization with DBCO PEG linker. The resulting mass shift of 1148 g/mol corresponds to the molecular weight of the linker. (d) Conjugation efficiency of DBCO-functionalized ligands to IT50 NPs and (e) calculated average number of ligands per NP measured by UV absorbance at 280 nm. Data is represented as the average ± SEM of N = 3 nanoparticle preparations.
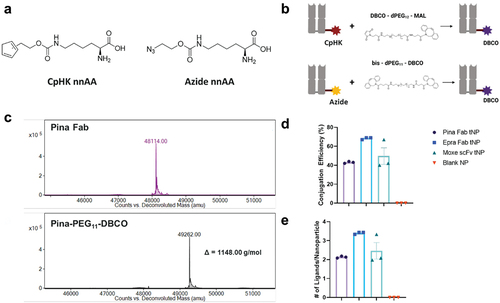
Figure 4. Uptake and trafficking response to endocytosis inhibitors internalization assay was performed using Moxe-scFv tNPs in untreated CD22+ AD-293 cells (a) or cells pretreated with 5 mM sodium azide (b). Similarly, the assay was repeated using Pina Fab tNPs in untreated CD22+ AD-293 cells (c) or cells pretreated with bafilomycin (d). Confocal imaging of cellular uptake of Pina Fab tNPs is shown in (e). Scale bar = 30 nm. Blue = Hoescht nuclear stain, green = AF488 fluorophore, red = pHrodo red fluorophore. All data is represented as the average ± SEM of N = 3 biological replicates.
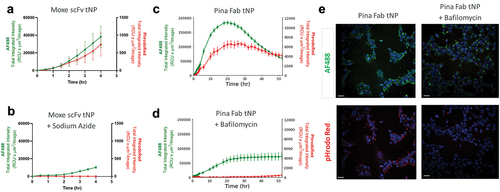
Figure 5. CD22-targeted internalization of tNPs in engineered CD22 + AD-293 cells. (a-d) fluorescence intensity of AF488 and pHrodo Red following treatment with non-targeted and CD-22 targeted NPs at a dose of 1 µg/well. Imaging and analysis were performed using the incucyte high content imager. Peak fluorescence intensity for each tNP formulation in the AF488 (e) and pHrodo Red (f) channels are shown. Comparisons between fluorescence of WT and CD22 + cells were performed using two-way ANOVA with Sidak multiple comparisons test. ***P < 0.001, ****P < 0.0001. All data are represented as the average ± SEM of N = 3 biological replicates.
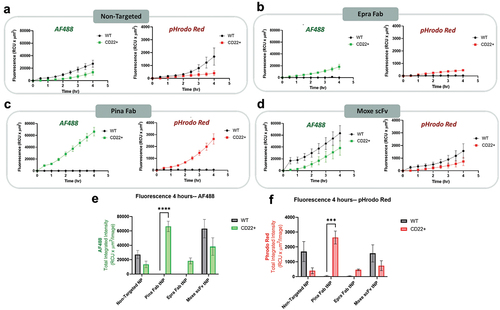
Figure 6. CD22-targeted internalization of tNPs in cancer cell lines MV411 and OCI-Ly-19. (a-d) fluorescence intensity of AF488 and pHrodo red in MV411 (CD22-) and OCI-LY-19 (CD22+) following treatment with non-targeted and CD22 targeted NPs at a dose of 1 µg/well. Imaging and analysis were performed using the incucyte high content imager. Peak fluorescence intensity for each tNP formulation in the AF488 (e) and pHrodo red (f) channels are shown. Comparisons between fluorescence of MV411 and OCI-Ly-19 cells were performed using two-way ANOVA with Sidak multiple comparisons test. ***P < 0.001, ****P < 0.0001. All data are represented as the average ± SEM of N = 3 biological replicates.
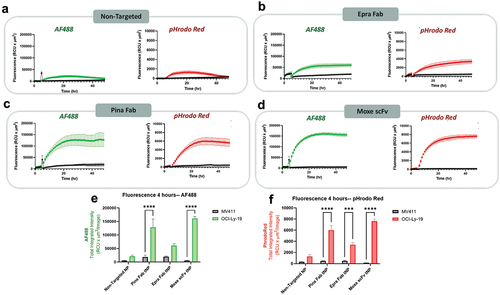
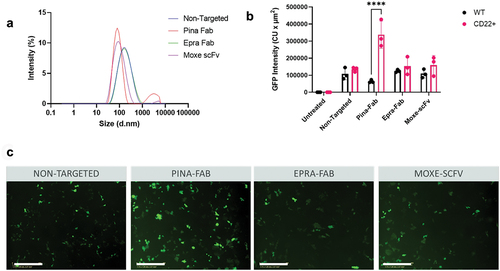
Figure 7. Performance of CD22 targeting ligands for GFP DNA delivery using PLL-based NPs. (a) Size of non-targeted and CD22-targeted NPs by DLS. (b) GFP expression by image analysis of WT and CD22+ AD-293 cells 62 h after transfection with PLL NPs. Comparisons between GFP expression of MV411 and OCI-Ly-19 cells were performed using two-way ANOVA with Sidak multiple comparisons test. ****p < 0.0001. All data are represented as the average ± SEM of N = 3 biological replicates. (c) Images of GFP expression in CD22+ AD-293 cells 62 h after transfection. Scale bar = 400 µm.