
Figures & data
Figure 1. Greenhouse gas fluxes in the business as usual (BAU) and project scenarios aggregated over all the surveyed sites (n = 28), and broken down by source of emissions. Fluxes of all sites have been normalized to a per hectare basis, to facilitate comparison between sites, which vary in size.
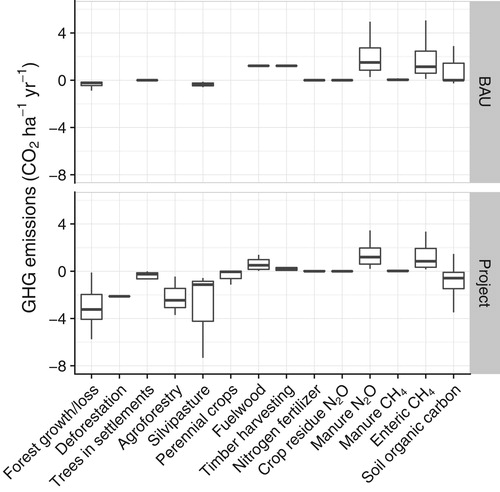
Figure 2. Summary of carbon benefits aggregated over all study sites (n = 28). Positive carbon benefits indicate a net reduction in greenhouse-gas emissions. Black dots indicate median values, and boxes show interquartile range. Outliers not shown.Note: SOC, soil organic carbon; GHG, greenhouse gas.
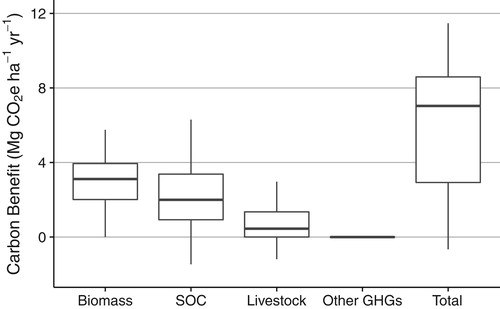
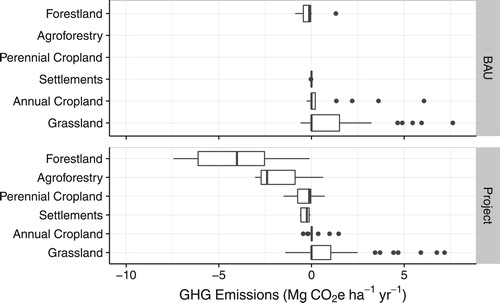
Figure 3. Net greenhouse gas fluxes from study sites, aggregated by land use.Note: BAU, business as usual; GHG, greenhouse gas.
Supplemental material