Figures & data
Figure 1. The build-up of surplus in EU ETS by 2020. Source: Carbon Market Watch (Citation2014), p. 4.
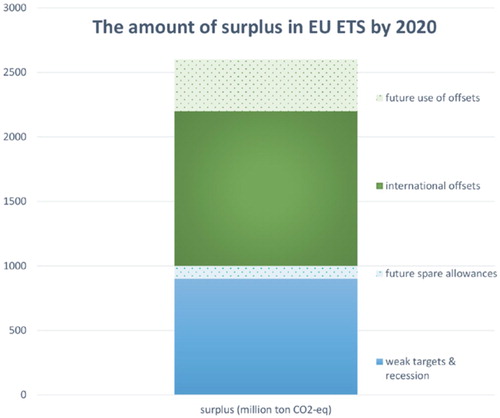
Figure 2. Energy cost shares in basic prices (in % of gross output). Source: European Competitiveness Report (Citation2014), p. 194.
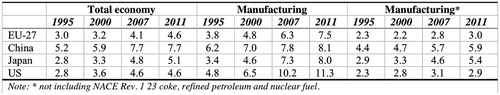
Figure 3. Energy cost shares by manufacturing industry in basic prices (in % of gross output). Source: European Competitiveness Report (Citation2014), p. 195.
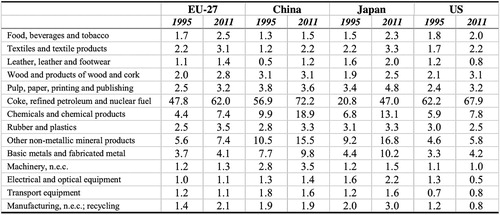
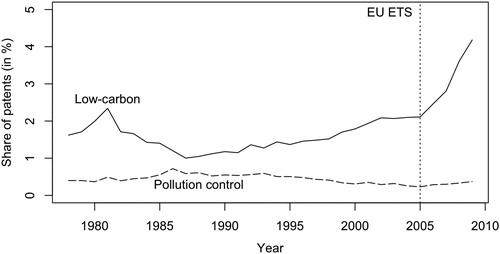
Figure 4. Share of low-carbon patents in total patents filed with the European Patent Office (1978–2009). Source: Calel and Dechezleprêtre (Citation2016), p. 177.