Figures & data
Figure 1. Pre-defined bidding structure. The numbers indicate bid values in SEK/tCO2. Grey boxes show the endpoints, i.e. the WTP values that were used for further analysis.
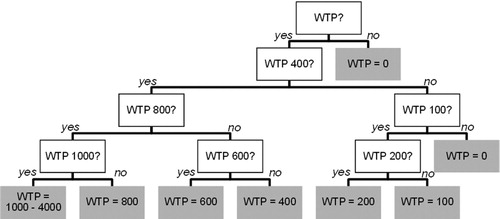
Figure 2. Example for WTP elicitation question. This is translated from the original survey which was conducted in Swedish.
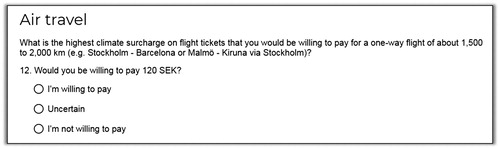
Table 1. Coding, mean and standard deviation (SD) of variables.
Figure 3. WTP distribution for short- and long-distance flights. Diamonds indicate the respective shares of acceptance at given bid levels; solid lines indicate cumulative acceptance. The grey area marks the survey’s bid range. For both graphs X-axis values correspond to a range of 0–4 000 SEK/ tCO2.
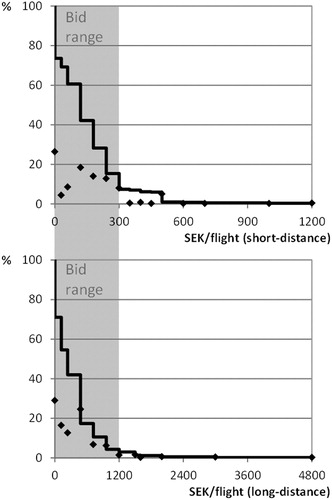
Figure 4. Juxtaposition of average WTP values and Swedish air ticket tax for short and long distance flights. The figures per ton CO2 were achieved by dividing WTP per flight and tax levels (SEK 60 short-distance and SEK 400 long-distance) by the CO2 emissions caused by the example-flights from the survey (0.3t short-distance and 1.2t long-distance).
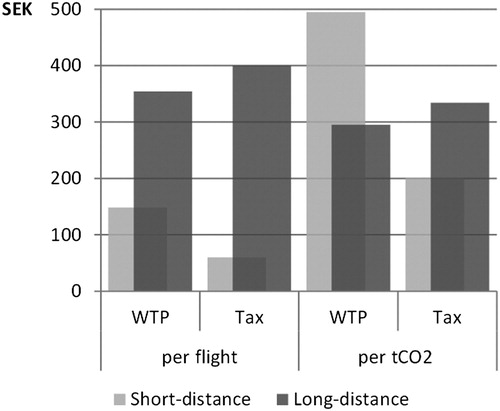
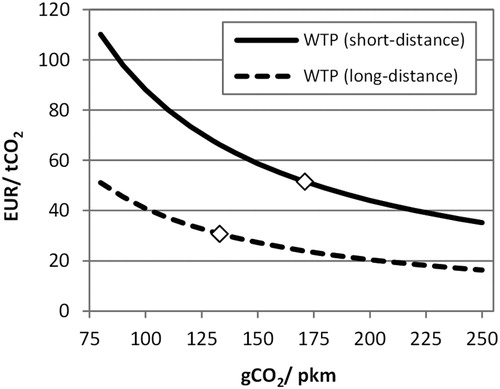
Figure 5. Sensitivity of mean WTP to changes in carbon intensity. Diamonds indicate the values used in this study. For comparison, the Swedish carrier SAS communicates average carbon intensity of 100 gCO2/pkm (Andersen Resare, Citation2015), while CO2 equivalent emissions are estimated to be higher by a factor of up to 2 (Lee et al., Citation2010).