Figures & data
Figure 1. Model framework – source data in grey, modelled data in blue and policy options in red, orange and green (GDP = Gross Domestic Product, EXIOBASE = Multi-Regional Environmentally Extended Supply-Use Table (MR-SUT) and Input-Output Table (MR-IOT), UK SIC = UK Standard Industrial Classification, COICOP = Classification of Individual Consumption According to Purpose, DUKES = Digest of UK Energy Statistics, IEA = International Energy Agency, UK MRIO = UK Multi-Regional Input Output Model.
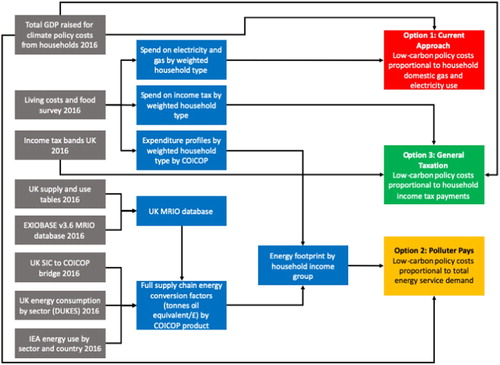
Figure 2. Relationship between the energy system and energy service demands – the energy demand chain 2016 (thousand tonnes of oil equivalent), Authors work.
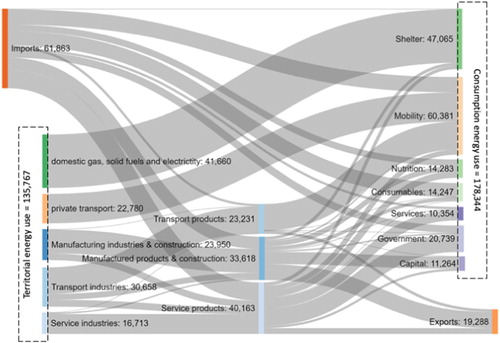
Figure 3. Low-carbon policy costs as a percentage of total household income by income groups (2016).
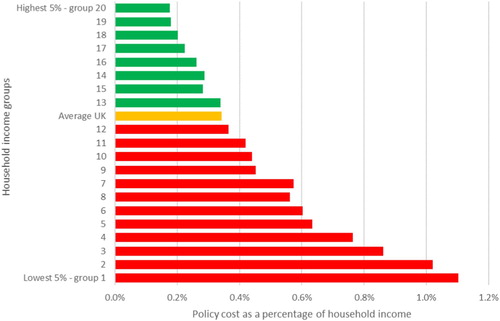
Figure 4. Total energy service demand by household income group (2016).
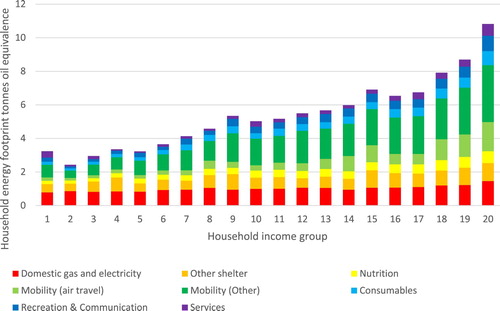
Figure 5. (a) Change in low-carbon policy cost payments for household income groups based on household energy footprint. Green bars are households that would see their contribution falling, red bars are households that would see an increase in payments. (b) Propensities by household type to be paying more or less towards low-carbon policy costs under option 2. We have chosen to display the household types which exhibit the greatest propensities to see a change in their bill. For the full dataset showing all regions, employment and household type please see the Supporting Information datasheet.
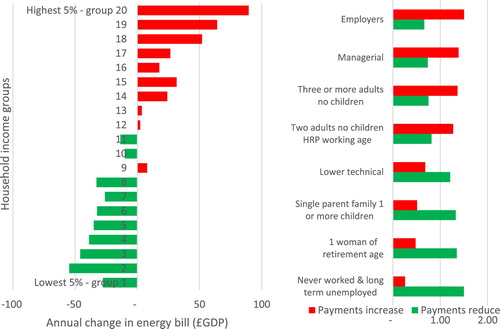
Figure 6. (a) Change in low-carbon policy costs based national share of income tax paid by income groups. Green bars are households that would see their contribution falling, red bars are households that would see an increase in payments. (b) Propensities by household type to pay more or less towards low-carbon policy costs under option 3. We have chosen to display the household types which exhibit the greatest propensities to see a change in their bill. For the full dataset showing all regions, employment and household type please see the Supporting Information datasheet.
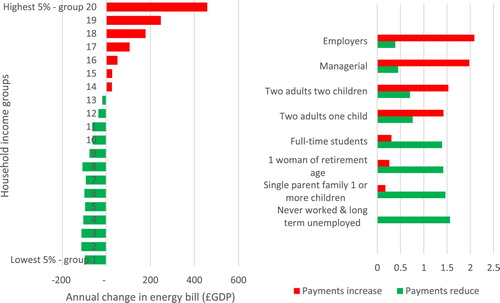
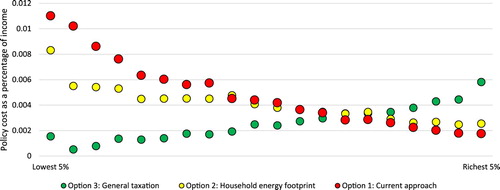
Figure 7. Proportion of household income for energy policy costs under 3 policy options by 20 household income groups.