
Figures & data
Figure 1. Average carbon intensity by industry.
Note: The graph depicts the average carbon intensity of sectors, measured as average of emissions in metric ton CO2 divided by sales in millions euro. Scope 1, 2 and 3 emissions are included for the 60 largest corporates in the euro area. Table A1 provides a detailed breakdown.Source: Author calculations based on ASSET4 ESG Scores in Datastream and company reports.
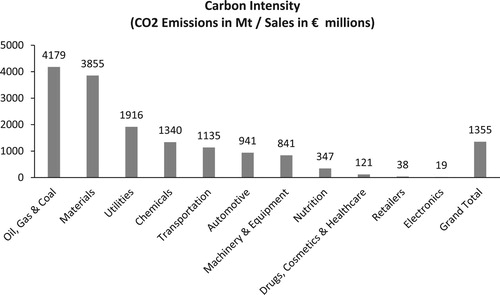
Table 1. Carbon factors in the asset and collateral framework.
Table 2. Outstanding holdings under Asset Purchases Programme, 20 December 2019.
Table 3. Collateral data of the Eurosystem, 20 December 2019.
Table 4. Tilting of corporate bond portfolio.
Table 5. Additional haircut for uncovered bank bonds.
Supplemental material