
Figures & data
Table 1. Annual and cumulated EU ETS GHG emissions in a globally cost-effective below-1.5°C pathway and in the EU Long-term Strategic Vision.
Figure 1. Base case and two alternative scenarios for the ETS cap 2021–2050 staying within a budget of 30 Gt CO2e (2016–2050). Source: Own calculations.
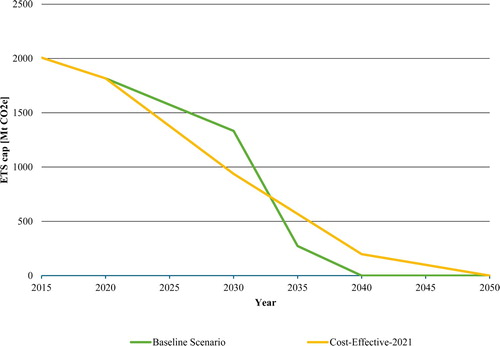
Figure 2. Scenarios accounting for the EU Energy policy targets adopted in 2018. Source: Own calculations.
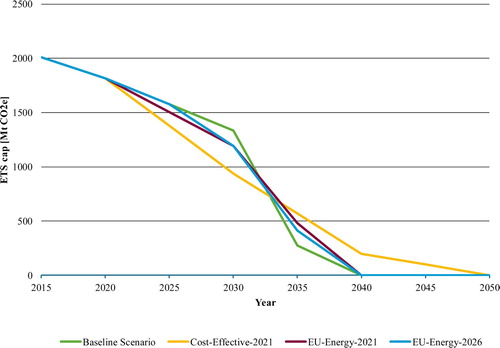
Table 2. Coal power generation in 2018 in countries with planned phase-outs of coal-fired power generation.
Table 3. Planned national phase-outs of coal-fired power generation – Potential emissions reductions.
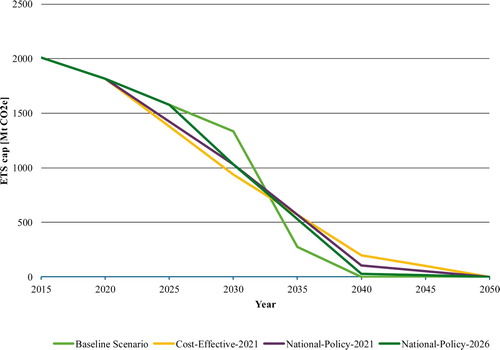
Figure 3. Scenarios accounting for national coal phase-outs by 2030. Source: Own calculations.
Supplemental material