
Figures & data
Figure 1. The economic structure of the E3ME model.
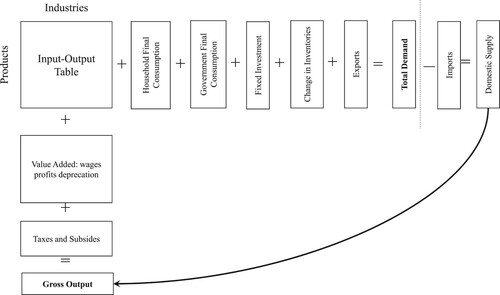
Figure 2. Global GDP in each scenario.
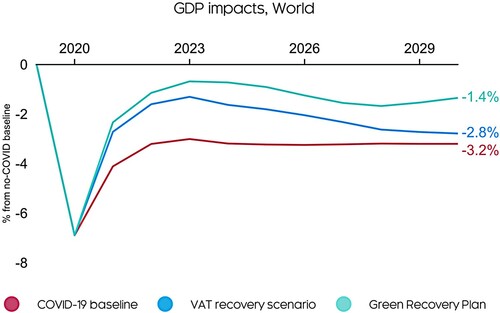
Figure 3. Benefits of the GRP, GDP % difference from VAT scenario.
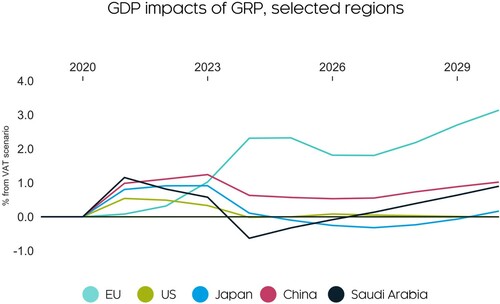
Table 1. Output by sectors, % difference from no-COVID baseline in 2020 and 2022.
Figure 4. Employment effects in all the scenarios, difference from no-COVID baseline.
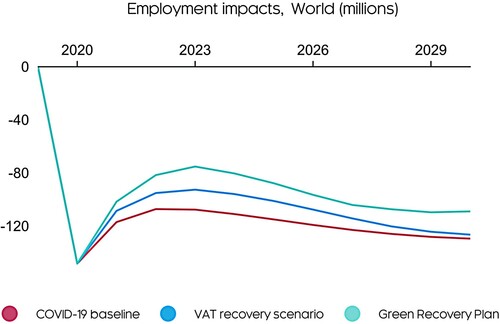
Figure 5. CO2 effects in all the scenarios, difference from no-COVID baseline.
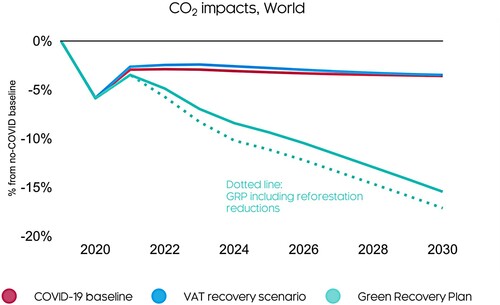
Figure 6. Relative contribution of each GRP policy (excl VAT change).
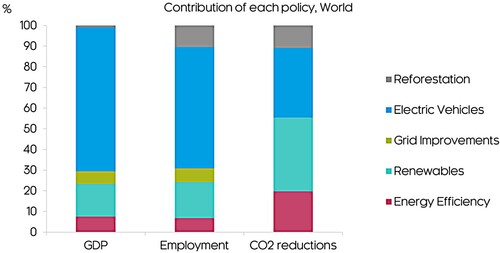
Figure 7. Sensitivity testing of GDP impacts.
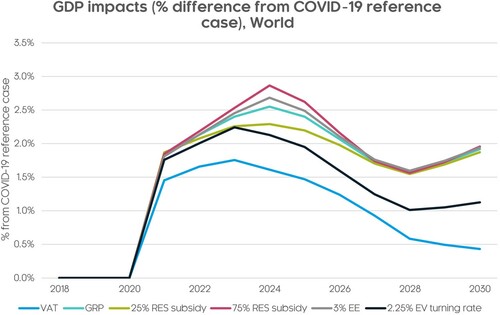
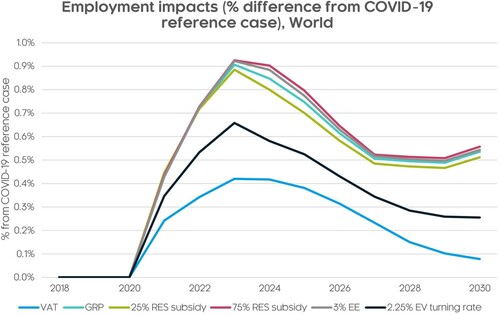
Figure 8. Sensitivity testing of employment impacts.
Supplemental material