
Figures & data
Figure 1. Total adaptation-related finance (commitments) to African countries and regions, by source and recipient regions, 2014–2018 (US$ millions, constant prices). Source: OECD DAC 2020.
Notes: Regional allocations include financial commitments that were reported separately from allocations to individual countries. For commitments reported under the Rio Marker methodology, the ‘Principal’ marker for adaptation is used.
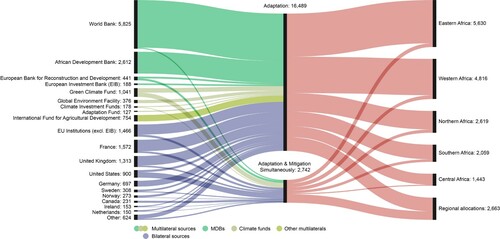
Figure 2. Trend of adaptation-related finance commitments to African regions over time (US$ millions, constant prices). Source: OECD DAC 2020.
Notes: For commitments reported under the Rio Marker methodology, the ‘Principal’ marker for adaptation is used.
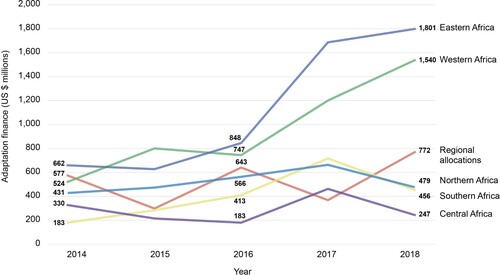
Figure 3. Total African adaptation- and mitigation-related finance (commitments) by country, 2014–2018 (US$ millions, constant prices). Source: OECD DAC 2020.
Notes: For commitments reported under the Rio Marker methodology, the ‘Principal’ marker for adaptation and for mitigation is used.
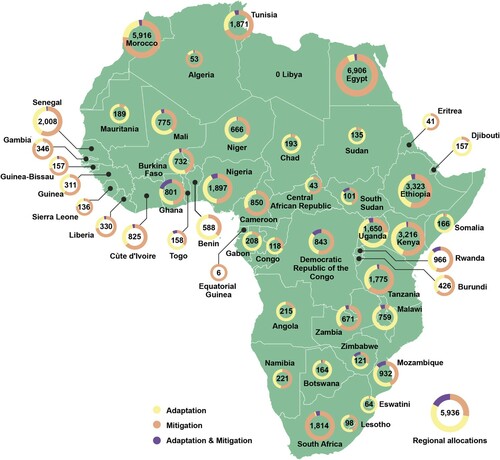
Figure 4. Adaptation-related commitments for each African country, per capita per year, 2014–2018 (US$/person, constant prices), ND-GAIN Vulnerability Index and LDC status (as of September 2020). Source: OECD DAC 2020.
Notes: For the calculation, average population figures over this period for each country were used. South Sudan received roughly US$1 per person but is not included in the figure because the ND-GAIN Index does not include data on its vulnerability. For commitments reported under the Rio Marker methodology, the ‘Principal’ marker for adaptation is used.
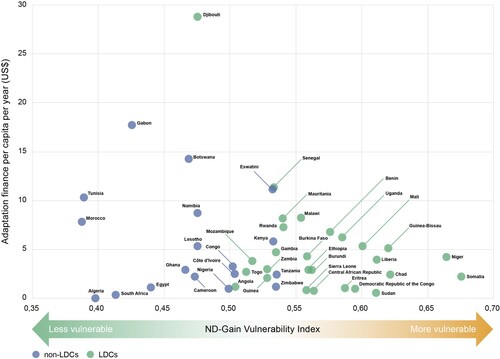
Figure 5. Total international public finance to all of Africa that targets adaptation, by sector (US$ millions, commitments, constant prices), 2014-2018. Source: OECD DAC 2020.
Notes: For commitments reported under the Rio Marker methodology, the ‘Principal’ marker for adaptation is used.
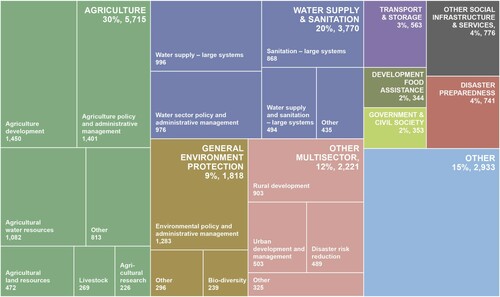
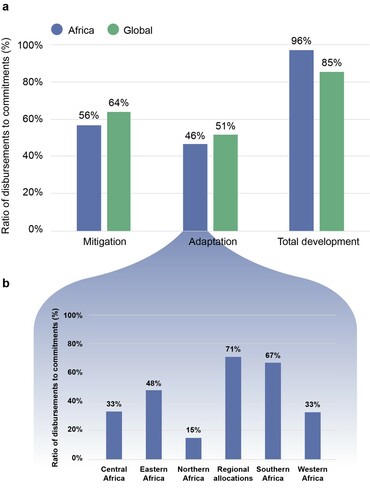
Figure 6. Disbursement ratios for international public finance principally targeting (i) mitigation, (ii) adaptation and (iii) total development. (a) disbursement ratios for Africa (blue) compared to global average (green) (for all funders except MDBs). (b) disbursement ratios for adaptation finance in each African region, 2014–2018 (for all funders except MDBs). Source: OECD DAC 2020.
Note: All disbursement ratio calculations are based on constant prices. Total development covers all development finance support to developing countries reported in Creditor Reporting System (CRS) database, including but not limited to adaptation- and mitigation-related finance. For commitments reported under the Rio Marker methodology, the ‘Principal’ marker for adaptation and for mitigation is used.
Supplemental Material
Download Zip (37.3 MB)Data availability statement
The data that support the findings of this study are openly available in OECD DAC’s External Development Finance Statistics on Climate Change at http://www.oecd.org/dac/financing-sustainable-development/development-finance-topics/climate-change.htm and in Creditor Reporting System (CRS) at https://stats.oecd.org/Index.aspx?DataSetCode=CRS1
These databases provide transaction-level data of global development finance. The subsets of these databases extracted and prepared for the analysis of this study are included in the supplementary material.