Figures & data
Table 1. Overview of policy tool types used in this paper.
Figure 1. Frequency of tool description by region and sector. Circles depict the percentage of papers in a region/sector combination that describe each tool. (Poverty: Poverty livelihoods & sustainable development; Health: Health, well-being & communities; Cities: Cities settlements & key infrastructure; Food: Food fibre & other ecosystem products; Water: Water & sanitation; Ocean: Ocean & coastal ecosystems; Terrestrial: Terrestrial & freshwater ecosystems).
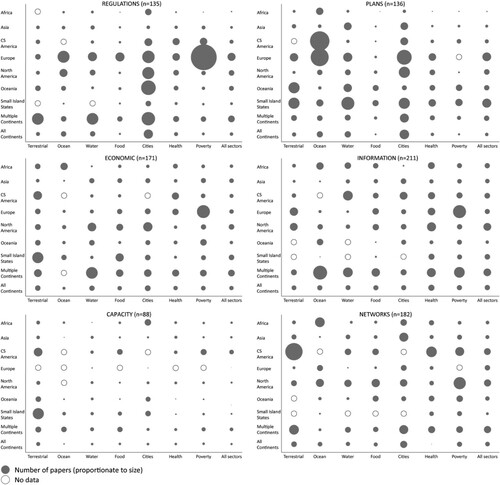
Table 2. Odds ratios (ORs) predicted by logistic regression models of factors associated with tool use.
Figure 2. Tools by the targeted marginalized group.
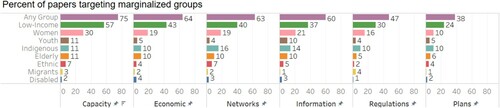
Table 3. Ordered logistic regression predicting depth, scope, and speed of adaptation by tool use.
Table A1. Variables from the GAMI dataset.
Table A2. Transformation potential coding.
Table A3. Total papers in dataset by region and sector.
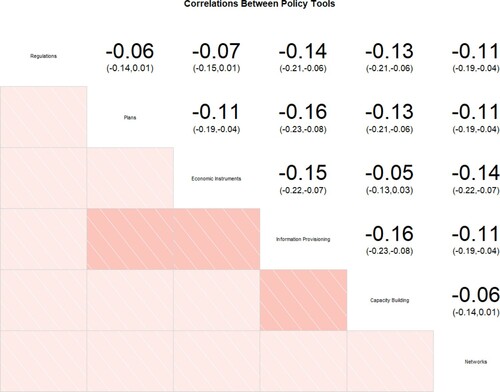
Figure A1. Phi correlations between presence or absence of tool types. Analysis uses the subset of papers that described at least one tool type, to remove spurious (0,0) data points.